Why didn't the markets rise after the Fed's announcement?
USD: Sep '23 is Up at 105.165.
Energies: Oct '23 Crude is Down at 88.67.
Financials: The Dec '23 30 Year T-Bond is Down 37 ticks and trading at 117.13.
Indices: The Dec '23 S&P 500 emini ES contract is 110 ticks Lower and trading at 4419.50.
Gold: The Dec'23 Gold contract is trading Down at 1944.80.
Initial conclusion
This is not a correlated market. The USD is Up and Crude is Down which is normal, but the 30 Year T-Bond is trading Lower. The Financials should always correlate with the US dollar such that if the dollar is Higher, then the bonds should follow and vice-versa. The S&P is Lower, and Crude is trading Higher which is correlated. Gold is trading Lower which is correlated with the US dollar trading Up. I tend to believe that Gold has an inverse relationship with the US Dollar as when the US Dollar is down, Gold tends to rise in value and vice-versa. Think of it as a seesaw, when one is up the other should be down. I point this out to you to make you aware that when we don't have a correlated market, it means something is wrong. As traders you need to be aware of this and proceed with your eyes wide open. All of Asia is trading Lower. Currently all of Europe is trading Lower as well.
Possible challenges to traders
-
Unemployment Claims is out at 8:30 AM EST. This is Major.
-
Philly Fed Manufacturing Index is out at 8:30 AM EST. This is Major.
-
Current Account is out at 8:30 AM EST. This is Major.
-
Existing Home Sales is out at 10 AM EST. This is Major.
-
CB Leading Index m/m is out at 10 AM EST. This is Major.
-
Natural Gas Storage is out at 10:30 AM EST. This is Major.
Treasuries
Traders, please note that we've changed the Bond instrument from the 30 year (ZB) to the 10 year (ZN). They work exactly the same.
We've elected to switch gears a bit and show correlation between the 10-year bond (ZN) and the S&P futures contract. The S&P contract is the Standard and Poor's, and the purpose is to show reverse correlation between the two instruments. Remember it's likened to a seesaw, when up goes up the other should go down and vice versa.
Yesterday the ZN migrated Lower at around 2 PM EST as the S&P hit a Low at around the same time. If you look at the charts below the S&P gave a signal at around 2 PM and the ZN started its Downward slide. Look at the charts below and you'll see a pattern for both assets. S&P hit a Low at around 2 PM and migrated Higher. These charts represent the newest version of MultiCharts and I've changed the timeframe to a 15-minute chart to display better. This represented a Short opportunity on the 10-year note, as a trader you could have netted about a 20 plus ticks per contract on this trade. Each tick is worth $15.625. Please note: the front month for the ZN is now Dec '23. The S&P contract is now Dec' 23. I've changed the format to filled Candlesticks (not hollow) such that it may be more apparent and visible.
Charts courtesy of MultiCharts built on an AMP platform
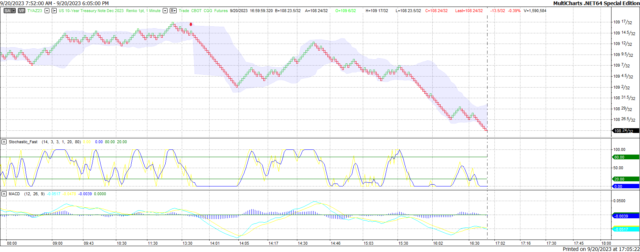
ZN - Dec 2023 - 9/20/23
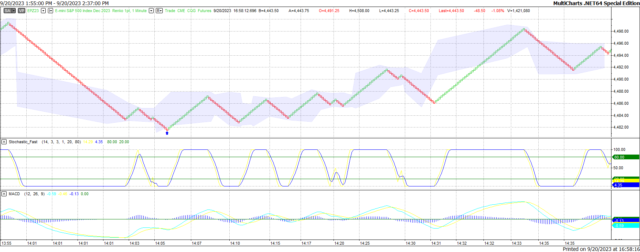
S&P - Dec 2023 - 9/20/23
Bias
Yesterday, we gave the markets a Neutral bias as it was FOMC Day, and we always maintain a Neutral bias on that day. Why? Because the markets have never shown any sense of normalcy on that day. The Fed decided to leave interest rates where they are at the moment, but the indices lost ground Wednesday after the announcement. Today we aren't dealing with a correlated market and will maintain a Neutral bias.
Could this change? Of Course. Remember anything can happen in a volatile market.
Commentary
So, at 2 PM yesterday everyone found out what the Fed would do and true to form they kept rates where they are. Just as we suggested yesterday, they would not lower rates and didn't. Truth be told this environment could use a rate reduction as everyone is tired of inflation and major purchases are being held due to higher interest rates. So why didn't the markets rise after the announcement? After all, the Fed didn't raise rates they just kept them where they are. The Fed also said it would leave the door open for one more rate hike before 2024. That means that within the next three months the Fed could hike again and at the worst possible time as that will be in the middle of the Holiday Season or the busiest shopping time and spending time of the year. Time will tell how this all works out. Today we have Unemployment Claims, Philly Fed Mfg. Index and Existing Home Sales. All major and all proven market movers. Could this move the markets in an upward direction? Only time will tell...
Author

Nick Mastrandrea
Market Tea Leaves


