This is not a correlated market

US Dollar: Sept USD Up at 93.515.
Energies: Aug'20 Crude is Down at 40.72.
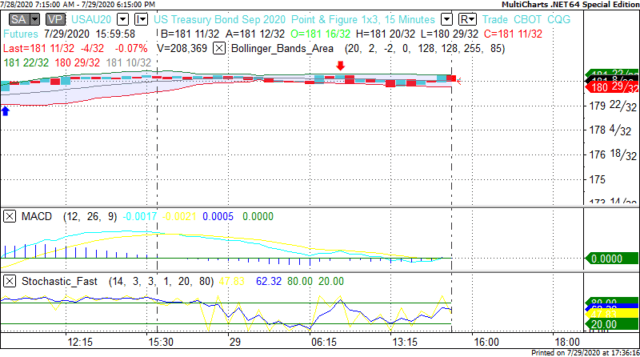
Financials: The Sept'20 30 year bond is Up 20 ticks and trading at 181.29.
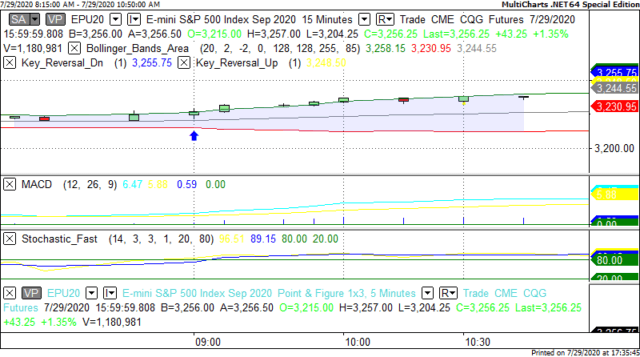
Indices: The Sept S&P 500 emini ES contract is 100 ticks Lower and trading at 3230.00.
Gold: The Aug'20 Gold contract is trading Down at 1945.10 Gold is 83 ticks Lower than its close.
Initial Conclusion
This is not a correlated market. The dollar is Up+ and Crude is Down- which is normal and the 30 year Bond is trading Higher. The Financials should always correlate with the US dollar such that if the dollar is lower then bonds should follow and vice-versa. The S&P is Lower and Crude is trading Lower which is not correlated. Gold is trading Lower which is correlated with the US dollar trading Up. I tend to believe that Gold has an inverse relationship with the US Dollar as when the US Dollar is down, Gold tends to rise in value and vice-versa. Think of it as a seesaw, when one is up the other should be down. I point this out to you to make you aware that when we don't have a correlated market, it means something is wrong. As traders you need to be aware of this and proceed with your eyes wide open.
At this time Asia is trading Lower with the exception of the Aussie exchange which is fractionally Higher. Currently Europe is trading Lower.
Possible Challenges To Traders Today:
-
Advance GDP is out at 8:30 AM EST. This is Major.
-
Advance GDP Price Index is out at 8:30 AM EST. This is Major.
-
Unemployment Claims are out at 8:30 AM EST, This is Major.
-
Natural Gas Storage is out at 10:30 AM EST. This is Major.
Treasuries
We've elected to switch gears a bit and show correlation between the 30 year bond (ZB) and The S&P futures contract. The S&P contract is the Standard and Poor's and the purpose is to show reverse correlation between the two instruments. Remember it's liken to a seesaw, when up goes up the other should go down and vice versa.
Yesterday the ZB made it's move at around 9 AM EST. The ZB hit a High at around that time and the S&P moved Higher. If you look at the charts below ZB gave a signal at around 9 AM EST and the S&P moved Higher at around the same time. Look at the charts below and you'll see a pattern for both assets. ZB hit a High at around 9 AM EST and the S&P was moving Higher shortly thereafter. These charts represent the newest version of MultiCharts and I've changed the timeframe to a 15 minute chart to display better. This represented a Shorting opportunity on the 30 year bond, as a trader you could have netted about 20 plus ticks per contract on this trade. Each tick is worth $31.25. Please note: the front month for the ZB is now Sept '20. The S&P contract has been changed to Sept '20. I've changed the format to Renko bars such that it may be more apparent and visible.
Charts Courtesy of MultiCharts built on an AMP platform.
Bias
Yesterday we gave the markets a Neutral bias as it was FOMC Day and we always maintain a Neutral bias on that day. The Dow gained 160 points and the other indices gained ground as well. Today we aren't dealing with a correlated market and our bias is to the Downside.
Could this change? Of Course. Remember anything can happen in a volatile market.
Commentary
Well the Federal Reserve didn't raise rates yesterday and we never thought they would given everything that's happening now. They did say that the health of the economy is tied to the pandemic the sooner we defeat this virus the better off we'll be. They also suggested that Congress must move aggressively when it comes to a stimulus package. What irks me about all this is the Senate has had the House bill since May 15th and are now just getting around to debating and potentially compromising the bill? Don't you love it when a government body is so cavalier with other people's lives and livelihood? Sorry to say but this is quite deplorable and we as Americans deserve better.
Author

Nick Mastrandrea
Market Tea Leaves


