The Day After

Good Morning Traders,
As of this writing 4 AM EST, here's what we see:
US Dollar: March USD is Up at 95.380.
Energies: April '19 Crude is Down at 60.15.
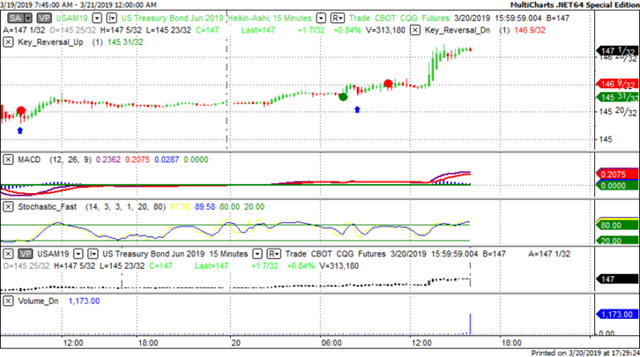
Financials: The Jun 30 year bond is Up 7 ticks and trading at 147.06.
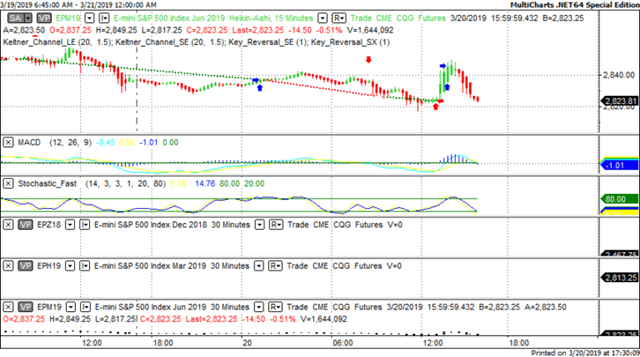
Indices: The Mar S&P 500 emini ES contract is 18 ticks Lower and trading at 2822.50.
Gold: The April Gold contract is trading Up at 1319.70 Gold is 180 ticks Higher than its close.
Initial Conclusion
This is not a correlated market. The dollar is Up+ and Crude is Down- which is normal and the 30 year Bond is trading Higher. The Financials should always correlate with the US dollar such that if the dollar is lower then bonds should follow and vice-versa. The S&P is Lower and Crude is trading Lower which is not correlated. Gold is trading Higher which is not correlated with the US dollar trading Higher. I tend to believe that Gold has an inverse relationship with the US Dollar as when the US Dollar is down, Gold tends to rise in value and vice-versa. Think of it as a seesaw, when one is up the other should be down. I point this out to you to make you aware that when we don't have a correlated market, it means something is wrong. As traders you need to be aware of this and proceed with your eyes wide open.
At this hour Asia is trading Higher with the exception of the Hang Seng which is trading Lower. Currently all of Europe is trading Lower.
Possible Challenges To Traders Today
-
Philly Fed Manufacturing Index is out at 8:30 AM EST. This is major.
-
Unemployment Claims is out at 8:30 AM EST. This is major.
-
CB Leading Index m/m is out at 10 AM EST. This is major.
-
Natural Gas Storage is out at 10:30 AM EST. Major.
Treasuries
We've elected to switch gears a bit and show correlation between the 30 year bond (ZB) and The YM futures contract. The YM contract is the DJIA and the purpose is to show reverse correlation between the two instruments. Remember it's liken to a seesaw, when up goes up the other should go down and vice versa.
Yesterday the ZB made a major move at around 8:30 AM EST. The ZB hit a Low at around that time and the YM hit a High. If you look at the charts below ZB gave a signal at around 9 AM EST and the YM was moving Lower at the same time. Look at the charts below and you'll see a pattern for both assets. ZB hit a Low at around 9 AM and the YM was moving Lower at the same time. These charts represent the newest version of MultiCharts and I've changed the timeframe to a 15 minute chart to display better. This represented a Long opportunity on the 30 year bond, as a trader you could have netted about 30 ticks per contract on this trade. Each tick is worth $31.25. Please note: the front month for the ZB contract is now June, 2019
Charts Courtesy of MultiCharts built on an AMP platform
Bias
Yesterday we gave the markets a Neutral bias as it was FOMC Day. The Dow dropped 142 points, the S&P lost 8 but the Nasdaq gained 5. Today we aren't dealing with a correlated market and our bias is to the Downside.
Could this change? Of Course. Remember anything can happen in a volatile market.
Commentary
One would wonder what happened yesterday? The Fed didn't hike yet the Dow and S&P both lost ground. One would think the opposite would occur, but not the case yesterday. Why?? When the Federal Reserve starts to take a dovish stance, the perception is that things are worse than they appear. Unfortunately in financial markets perception becomes reality. This is very liken to the analogy of "buy the sizzle" such that when something appears real it is but when reality sets in its time to sell. Now it may very be that the Fed is doing only to prevent any further weakness in the markets but traders will take their own cues. But as in all things only time will tell....
Author

Nick Mastrandrea
Market Tea Leaves


