Good Morning Traders,

As of this writing 5:25 AM EST, here’s what we see:

US Dollar: March USD is Down at 95.010.
Energies: March '19 Crude is Down at 54.17.
Financials: The Mar 30 year bond is Up 18 ticks and trading at 146.08.
Indices: The Mar S&P 500 emini ES contract is 6 ticks Higher and trading at 2684.00.
Gold: The Feb Gold contract is trading Up at 1326.80. Gold is 112 ticks Higher than its close.

Initial Conclusion

This is not a correlated market. The dollar is Down- and Crude is Down- which is not normal but the 30 year Bond is trading Higher. The Financials should always correlate with the US dollar such that if the dollar is lower then bonds should follow and vice-versa. The S&P is Higher and Crude is trading Lower which is correlated. Gold is trading Higher which is correlated with the US dollar trading Lower. I tend to believe that Gold has an inverse relationship with the US Dollar as when the US Dollar is down, Gold tends to rise in value and vice-versa. Think of it as a seesaw, when one is up the other should be down. I point this out to you to make you aware that when we don't have a correlated market, it means something is wrong. As traders you need to be aware of this and proceed with your eyes wide open.

At this hour all of Asia is trading Higher. Currently Europe is trading Higher with the exception of the Milan and Spanish IBEX exchanges which are Lower at this time..

Possible Challenges To Traders Today

  • Challenger Job Cuts is out at 7:30 AM EST. This is major.

  • Employment Cost Index is out at 8:30 AM EST. This is not major.

  • Unemployment Claims is out at 8:30 AM EST. This is major.

  • Chicago PMI is out at 9:45 AM. This is major.

  • Natural Gas Storage is out at 10:30 AM. This is major.

 Treasuries

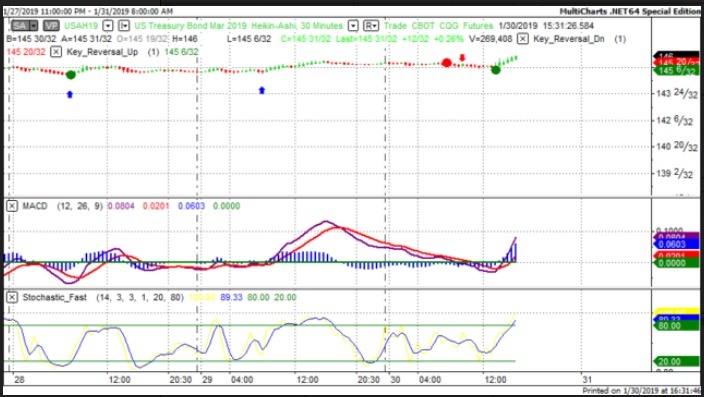
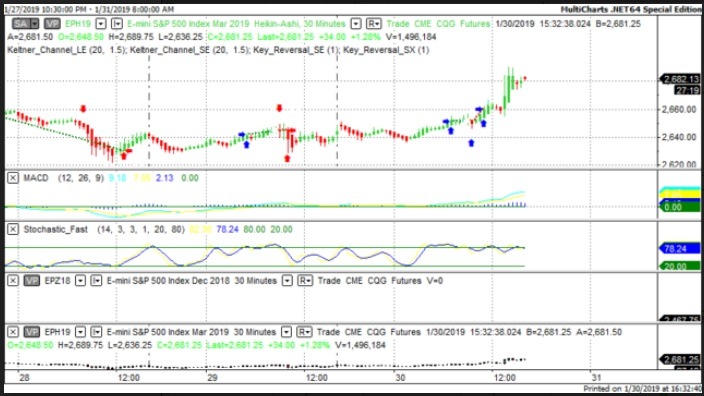
We've elected to switch gears a bit and show correlation between the 30 year bond (ZB) and The YM futures contract. The YM contract is the DJIA and the purpose is to show reverse correlation between the two instruments. Remember it's liken to a seesaw, when up goes up the other should go down and vice versa.

Yesterday the ZB made a major move at around 9 AM EST. The ZB hit a High at around that time and the YM hit a Low. If you look at the charts below ZB gave a signal at around 9 AM EST and the YM was moving Higher at the same time. Look at the charts below and you'll see a pattern for both assets. ZB hit a High at around 9 AM and the YM was moving Higher at the same time. These charts represent the newest version of MultiCharts and I've changed the timeframe to a 30 minute chart to display better. This represented a Shorting opportunity on the 30 year bond, as a trader you could have netted about a dozen ticks per contract on this trade. Each tick is worth $31.25. Please note: the front month for the ZB contract is now March, 2019

Charts Courtesy of MultiCharts built on an AMP platform.

Tea

Tea

Bias

Yesterday we gave the markets a Neutral bias as it was FOMC Day and as is our custom; we always maintain a Neutral bias on that day. The Dow rose 435 points and the other indices gained ground as well. Today we aren't dealing with a correlated market and our bias is Neutral.

Could this change? Of Course. Remember anything can happen in a volatile market.

Commentary

Well FOMC Day came and went and it appears the Fed took our advice and not raise (only kidding, of course!!!). We're glad that the Fed didn't hike the FFR as currently many US firms are struggling with earnings issues and the worst thing that could occur now is for the Federal Reserve to hike rates and make the cost of borrowing higher. I believe that the Real Estate industry was waiting for this decision as Pending Home Sales fell by more than 2%. Many will say this isn't home buying season and there is a measure of truth to this but not hiking will certainly help.

Trading performance displayed herein is hypothetical. The following Commodity Futures Trading Commission (CFTC) disclaimer should be noted.

Hypothetical performance results have many inherent limitations, some of which are described below. No representation is being made that any account will or is likely to achieve profits or losses similar to those shown.

In fact, there are frequently sharp differences between hypothetical performance results and the actual results subsequently achieved by any particular trading program. One of the limitations of hypothetical performance trading results is that they are generally prepared with the benefit of hindsight.

In addition, hypothetical trading does not involve financial risk, and no hypothetical trading record can completely account for the impact of financial risk in actual trading. For example, the ability to withstand losses or to adhere to a particular trading program in spite of trading losses are material points which can also adversely affect actual trading results.

There are numerous other factors related to the markets in general or to the implementation of any specific trading program which cannot be fully accounted for in the preparation of hypothetical performance results and all of which can adversely affect actual trading results.

Trading in the commodities markets involves substantial risk and YOU CAN LOSE A LOT OF MONEY, and thus is not appropriate for everyone. You should carefully consider your financial condition before trading in these markets, and only risk capital should be used.

In addition, these markets are often liquid, making it difficult to execute orders at desired prices. Also, during periods of extreme volatility, trading in these markets may be halted due to so-called “circuit breakers” put in place by the CME to alleviate such volatility. In the event of a trading halt, it may be difficult or impossible to exit a losing position.

Recommended Content


Recommended Content

Editors’ Picks

AUD/USD defends 0.6400 after Chinese data dump

AUD/USD defends 0.6400 after Chinese data dump

AUD/USD has found fresh buyers near 0.6400, hanging near YTD lows after strong China's Q1 GDP data. However, the further upside appears elusive amid weak Chinese activity data and sustained US Dollar demand. Focus shifts to US data, Fedspeak. 

AUD/USD News

USD/JPY stands tall near multi-decade high near 154.50

USD/JPY stands tall near multi-decade high near 154.50

USD/JPY keeps its range near multi-decade highs of 154.45 in the Asian session on Tuesday. The hawkish Fed expectations overshadow the BoJ's uncertain rate outlook and underpin the US Dollar at the Japanese Yen's expense. The pair stands resilient to the Japanese verbal intervention. 

USD/JPY News

Gold price holds steady below $2,400 mark, bullish potential seems intact

Gold price holds steady below $2,400 mark, bullish potential seems intact

Gold price oscillates in a narrow band on Tuesday and remains close to the all-time peak. The worsening Middle East crisis weighs on investors’ sentiment and benefits the metal. Reduced Fed rate cut bets lift the USD to a fresh YTD top and cap gains for the XAU/USD.

Gold News

SOL primed for a breakout as it completes a rounding bottom pattern

SOL primed for a breakout as it completes a rounding bottom pattern

Solana price has conformed to the broader market crash, following in the steps of Bitcoin price that remains in the red below the $65,000 threshold. For SOL, however, the sensational altcoin could have a big move in store.

Read more

Israel-Iran military conflict views and takeaways

Israel-Iran military conflict views and takeaways

Iran's retaliatory strike on Israel is an escalation of Middle East tensions, but not necessarily a pre-cursor to broader regional conflict. Events over the past few weeks in the Middle East, more specifically this past weekend, reinforce that the global geopolitical landscape remains tense.

Read more

Majors

Cryptocurrencies

Signatures