The Day After

Good Morning Traders,
As of this writing 4 AM EST, here’s what we see:
US Dollar: Jun. USD is Down at 93.400.
Energies: Jul '18 Crude is Up at 66.68.
Financials: The Sept 30 year bond is Up 19 ticks and trading at 143.06.
Indices: The Sept S&P 500 emini ES contract is 22 ticks Lower and trading at 2773.50.
Gold: The Aug gold contract is trading Up at 1306.30. Gold is 50 ticks Higher than its close.
Initial Conclusion
This is not a correlated market. The dollar is Down- and Crude is Up+ which is normal but the 30 year Bond is trading Higher. The Financials should always correlate with the US dollar such that if the dollar is lower then bonds should follow and vice-versa. The S&P is Lower and Crude is trading Higher which is correlated. Gold is trading Up+ which is correlated with the US dollar trading Down-. I tend to believe that Gold has an inverse relationship with the US Dollar as when the US Dollar is down, Gold tends to rise in value and vice-versa. Think of it as a seesaw, when one is up the other should be down. I point this out to you to make you aware that when we don't have a correlated market, it means something is wrong. As traders you need to be aware of this and proceed with your eyes wide open.
At this hour all of Asia is trading Lower. Currently all of Europe is trading Lower as well.
Possible Challenges To Traders Today
-
Retail Sales is out at 8:30 AM EST. This is major.
-
Core Retail Sales is out at 8:30 AM EST. This is major.
-
Unemployment Claims is out at 8:30 AM EST. This is major.
-
Import Prices is out at 8:30 AM EST. This is not major.
-
Business Inventories is out at 10 AM EST. Major.
-
Natural Gas Storage is out at 10:30 AM EST. This is major.
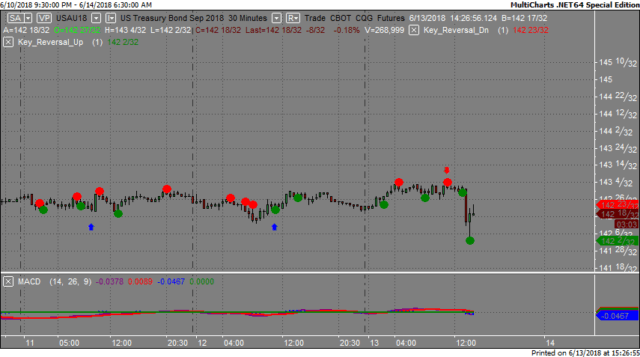
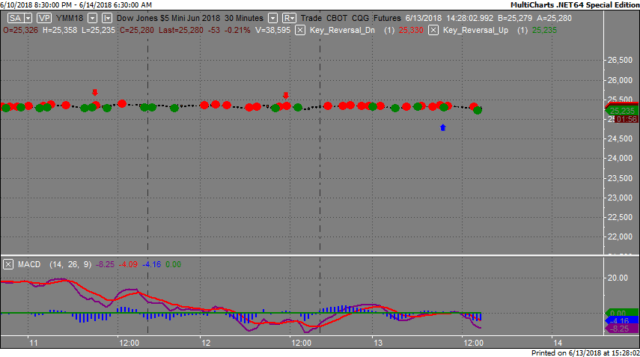
Treasuries
We've elected to switch gears a bit and show correlation between the 30 year bond (ZB) and The YM futures contract. The YM contract is the DJIA and the purpose is to show reverse correlation between the two instruments. Remember it's liken to a seesaw, when up goes up the other should go down and vice versa.
Yesterday the ZB made it's move at around 11 AM EST. The ZB hit a High at around that time and the YM traded sideways. If you look at the charts below ZB gave a signal at around 11 AM EST and the YM was moving sideways at the same time. Look at the charts below and you'll see a pattern for both assets. ZB hit a High at around 11 AM and the YM was trending sideways at the same time. These charts represent the newest version of MultiCharts and I've changed the timeframe to a 30 minute chart to display better. This represented a long opportunity on the 30 year bond, as a trader you could have netted about 20 plus ticks per contract on this trade. Each tick is worth $31.25.
Charts Courtesy of MultiCharts built on an AMP platform
Bias
Yesterday we gave the markets a Neutral bias as it was FOMC Day and the markets never act with any sense of normalcy on that day. The Dow dropped 120 points and the other indices lost ground as well. Today we aren't dealing with a correlated market and our bias is to the Downside.
Could this change? Of Course. Remember anything can happen in a volatile market.
Commentary
As predicted the Federal Reserve decided to hike the Federal Funds Rate aka the Overnight Rate and the markets fell. This means that the cost of borrowing will go up across the board and for anyone who has a variable APR (credit cards, heloc's, etc.) the cost of borrowing will increase. Additionally the Fed also mentioned during their press conference that they will raise 3 more times this year. We're thinking that they'll do it in September and December but the 3 month will be a surprise no doubt. The Fed also mentioned that starting next year they will hold a press conference at each meeting. In that way we won't be able to tell in advance if they'll hike at that meeting.
Author

Nick Mastrandrea
Market Tea Leaves


