The Day After

Good Morning Traders,
As of this writing 4:15 AM EST, here’s what we see:
US Dollar: Jun. USD is Down at 89.090.
Energies: May '18 Crude is Down at 65.15.
Financials: The June 30 year bond is Up 33 ticks and trading at 144.16.
Indices: The June S&P 500 emini ES contract is 75 ticks Lower and trading at 2700.25.
Gold: The April gold contract is trading Up at 1332.30. Gold is 108 ticks Higher than its close.
Initial Conclusion
This is not a correlated market. The dollar is Down- and Crude is Down- which is not normal but the 30 year Bond is trading Higher. The Financials should always correlate with the US dollar such that if the dollar is lower then bonds should follow and vice-versa. The S&P is Lower and Crude is trading Down- which is not correlated. Gold is trading Up+ which is correlated with the US dollar trading Down-. I tend to believe that Gold has an inverse relationship with the US Dollar as when the US Dollar is down, Gold tends to rise in value and vice-versa. Think of it as a seesaw, when one is up the other should be down. I point this out to you to make you aware that when we don't have a correlated market, it means something is wrong. As traders you need to be aware of this and proceed with your eyes wide open.
At this hour Asia is trading mainly Mixed with half the exchanges trading Higher and the other half Lower. Currently all of Europe is trading Lower.
Possible Challenges To Traders Today
Unemployment Claims are out at 8:30 AM EST. This is major.
HPI m/m is out at 9 AM EST. This is major.
Flash Manufacturing PMI is out at 9:45 AM EST. Major
Flash Services PMI is out at 9:45 AM EST. Major.
CB Leading Index is out at 10 AM EST. This is major.
Natural Gas Storage is out at 10:30 AM EST. This is major.
Treasuries
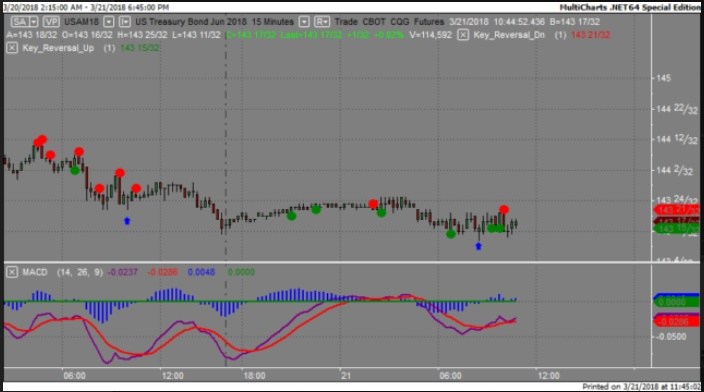
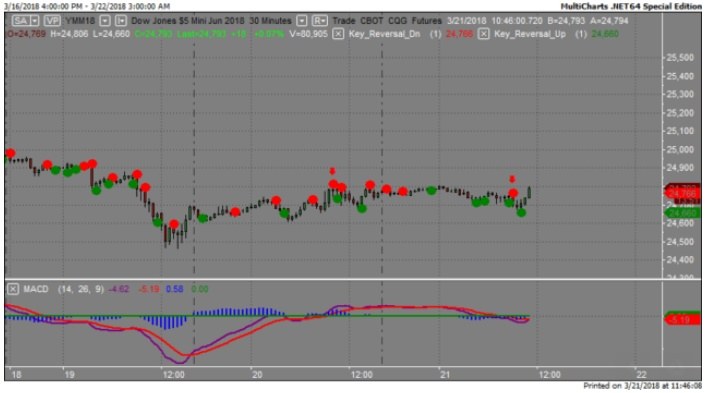
We've elected to switch gears a bit and show correlation between the 30 year bond (ZB) and The YM futures contract. The YM contract is the DJIA and the purpose is to show reverse correlation between the two instruments. Remember it's liken to a seesaw, when up goes up the other should go down and vice versa.
Yesterday the ZB made it's move at around 8:30 AM. The ZB hit a Low at around that time and the YM hit a High. If you look at the charts below ZB gave a signal at around 8:30 AM EST and the YM was moving Lower at the same time. Look at the charts below and you'll see a pattern for both assets. ZB hit a Low at around 8:30 AM and the YM hit a High. These charts represent the newest version of MultiCharts and I've changed the timeframe to a 30 minute chart to display better. This represented a Long opportunity on the 30 year bond, as a trader you could have netted about 15 ticks per contract on this trade. Each tick is worth $31.25.
Charts Courtesy of MultiCharts built on an AMP platform.
Bias
Yesterday we gave the markets a Neutral bias as it was FOMC Day and we always maintain a Neutral bias on that day. Why? Because the markets have never shown any sense of normalcy on that day. Today we aren't dealing with a correlated market and our bias is to the Downside.
Could this change? Of Course. Remember anything can happen in a volatile market.
Commentary
Well FOMC Day came and went and as predicted the Federal Reserve did raise rates by 25 basis points. Initially the markets went negative then turned positive but by the session close the Dow dropped 45 points and the other indices lost ground as well. This was Jerome Powell's first press conference as the Fed Chief and I must say he's impressive. Very composed and he strikes you as someone who can keep their cool and calm under pressure. The Fed has stated that their will be 3 more rate hikes in 2018 with more to come in 2019 but that will depend upon economic conditions at that time. We believe that the major reason for the hike was the robust job market in the US. Inflation is yet to be seen although the Fed thinks that come 2019 the rate will hit 2%, which is their target.
Author

Nick Mastrandrea
Market Tea Leaves


