Good Morning Traders,

As of this writing 4:10 AM EST, here’s what we see:

US Dollar: Sept. USD is Down at 93.350.
Energies: Sept Crude is Down at 48.64.
Financials: The Sept 30 year bond is Up 1 tick and trading at 153.06.
Indices: The Sept S&P 500 emini ES contract is 22 ticks Higher and trading at 2478.75.
Gold: The Aug gold contract is trading Up at 1261.90. Gold is 125 ticks Higher than its close.

Initial Conclusion

This is not a correlated market. The dollar is Down- and Crude is Down- which is not normal but the 30 year Bond is trading Higher. The Financials should always correlate with the US dollar such that if the dollar is lower then bonds should follow and vice-versa. The indices are Up+ and Crude is trading Down- which is correlated. Gold is trading Up+ which is correlated with the US dollar trading Down-. I tend to believe that Gold has an inverse relationship with the US Dollar as when the US Dollar is down, Gold tends to rise in value and vice-versa. Think of it as a seesaw, when one is up the other should be down. I point this out to you to make you aware that when we don’t have a correlated market, it means something is wrong. As traders you need to be aware of this and proceed with your eyes wide open.

At this hour all of Asia is trading to the Upside. As of this broadcast Europe is trading mainly Higher with the exception of the London and the Dax exchanges.

Possible Challenges To Traders Today

– Core Durable Goods Orders is out at 8:30 AM EST. This is major.

– Durable Goods Orders is out at 8:30 AM EST. This is major.

– Unemployment Claims is out at 8:30 AM EST. This is major.

– Goods Trade Balance is out at 8:30 AM EST. This is major.

– Prelim Wholesale Inventories is out at 8:30 AM. This is not major.

– Natural Gas Storage is out at 10:30 AM EST. This is major.

Treasuries

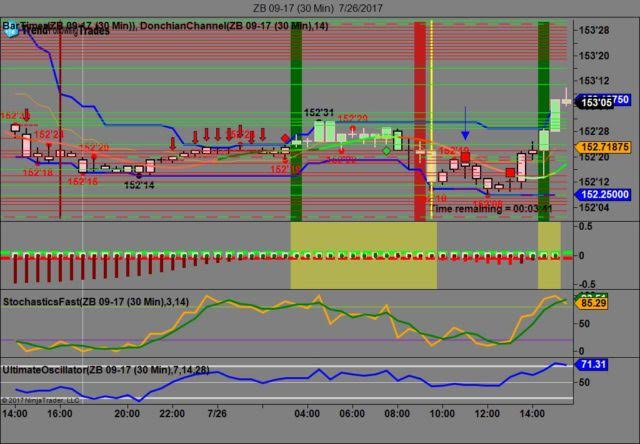
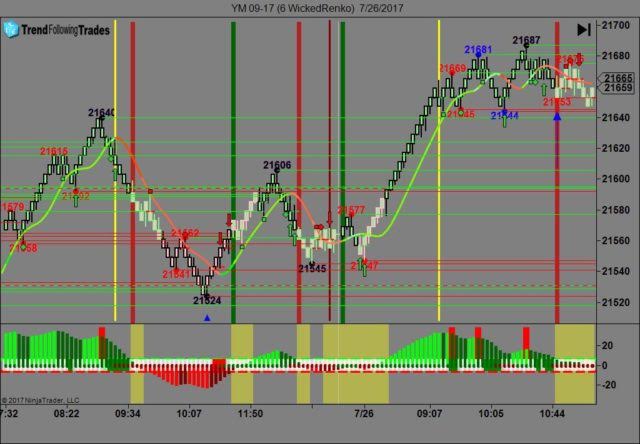
We’ve elected to switch gears a bit and show correlation between the 30 year bond (ZB) and The YM futures contract. The YM contract is the DJIA and the purpose is to show reverse correlation between the two instruments. Remember it’s liken to a seesaw, when up goes up the other should go down and vice versa.

Yesterday the ZB made it’s move at around 10 AM EST before the Crude Oil numbers came out. The ZB hit a High at around that time and the YM hit a Low. If you look at the charts below ZB gave a signal at around 10 AM and the YM was moving Higher at the same time. Look at the charts below and you’ll see a pattern for both assets. ZB hit a High at around 10 AM and the YM hit a Low. These charts represent the newest version of Trend Following Trades and I’ve changed the timeframe to a 30 minute chart to display better. This represented a shorting opportunity on the 30 year bond, as a trader you could have netted about 10 ticks per contract on this trade. Each tick is worth $31.25. We added a Donchian Channel to the charts to show the signals more clearly. Please note that the front month for the ZB contract is now September, 2017.

Charts Courtesy of Trend Following Trades built on a NinjaTrader platform.

Tea

Tea

Bias

Yesterday we gave the markets a neutral bias as it was FOMC Day and as is our custom, we maintained a neutral bias. Today we aren’t dealing with a correlated market however our bias is to the upside.

Could this change? Of Course. Remember anything can happen in a volatile market.

Commentary

As predicted the Federal Reserve didn’t raise the FFR (Federal Funds Rate) aka the Overnight Rate. This in turn will insure that the banks don’t raise their rates as that would pose no competitive advantage to them. The Dow traded higher by 98 points and the other indices gained ground as well. Today we have Durable Goods, Core Durable Goods and Unemployment Claims; all of which are major and proven market movers.

Trading performance displayed herein is hypothetical. The following Commodity Futures Trading Commission (CFTC) disclaimer should be noted.

Hypothetical performance results have many inherent limitations, some of which are described below. No representation is being made that any account will or is likely to achieve profits or losses similar to those shown.

In fact, there are frequently sharp differences between hypothetical performance results and the actual results subsequently achieved by any particular trading program. One of the limitations of hypothetical performance trading results is that they are generally prepared with the benefit of hindsight.

In addition, hypothetical trading does not involve financial risk, and no hypothetical trading record can completely account for the impact of financial risk in actual trading. For example, the ability to withstand losses or to adhere to a particular trading program in spite of trading losses are material points which can also adversely affect actual trading results.

There are numerous other factors related to the markets in general or to the implementation of any specific trading program which cannot be fully accounted for in the preparation of hypothetical performance results and all of which can adversely affect actual trading results.

Trading in the commodities markets involves substantial risk and YOU CAN LOSE A LOT OF MONEY, and thus is not appropriate for everyone. You should carefully consider your financial condition before trading in these markets, and only risk capital should be used.

In addition, these markets are often liquid, making it difficult to execute orders at desired prices. Also, during periods of extreme volatility, trading in these markets may be halted due to so-called “circuit breakers” put in place by the CME to alleviate such volatility. In the event of a trading halt, it may be difficult or impossible to exit a losing position.

Recommended Content


Recommended Content

Editors’ Picks

AUD/USD tumbles toward 0.6350 as Middle East war fears mount

AUD/USD tumbles toward 0.6350 as Middle East war fears mount

AUD/USD has come under intense selling pressure and slides toward 0.6350, as risk-aversion intensifies following the news that Israel retaliated with missile strikes on a site in Iran. Fears of the Israel-Iran strife translating into a wider regional conflict are weighing on the higher-yielding Aussie Dollar. 

AUD/USD News

USD/JPY breaches 154.00 as sell-off intensifies on Israel-Iran escalation

USD/JPY breaches 154.00 as sell-off intensifies on Israel-Iran escalation

USD/JPY is trading below 154.00 after falling hard on confirmation of reports of an Israeli missile strike on Iran, implying that an open conflict is underway and could only spread into a wider Middle East war. Safe-haven Japanese Yen jumped, helped by BoJ Governor Ueda's comments. 

USD/JPY News

Gold price edges higher on risk-off mood hawkish Fed signals

Gold price edges higher on risk-off mood hawkish Fed signals

Gold prices advanced late in the North American session on Thursday, underpinned by heightened geopolitical risks involving Iran and Israel. Federal Reserve officials delivered hawkish messages, triggering a jump in US Treasury yields, which boosted the Greenback.

Gold News

Dogwifhat price pumps 5% ahead of possible Coinbase effect

Dogwifhat price pumps 5% ahead of possible Coinbase effect

Dogwifhat price recorded an uptick on Thursday, going as far as to outperform its peers in the meme coins space. Second only to Bonk Inu, WIF token’s show of strength was not just influenced by Bitcoin price reclaiming above $63,000.

Read more

Israel vs. Iran: Fear of escalation grips risk markets

Israel vs. Iran: Fear of escalation grips risk markets

Recent reports of an Israeli aerial bombardment targeting a key nuclear facility in central Isfahan have sparked a significant shift out of risk assets and into safe-haven investments. 

Read more

Majors

Cryptocurrencies

Signatures