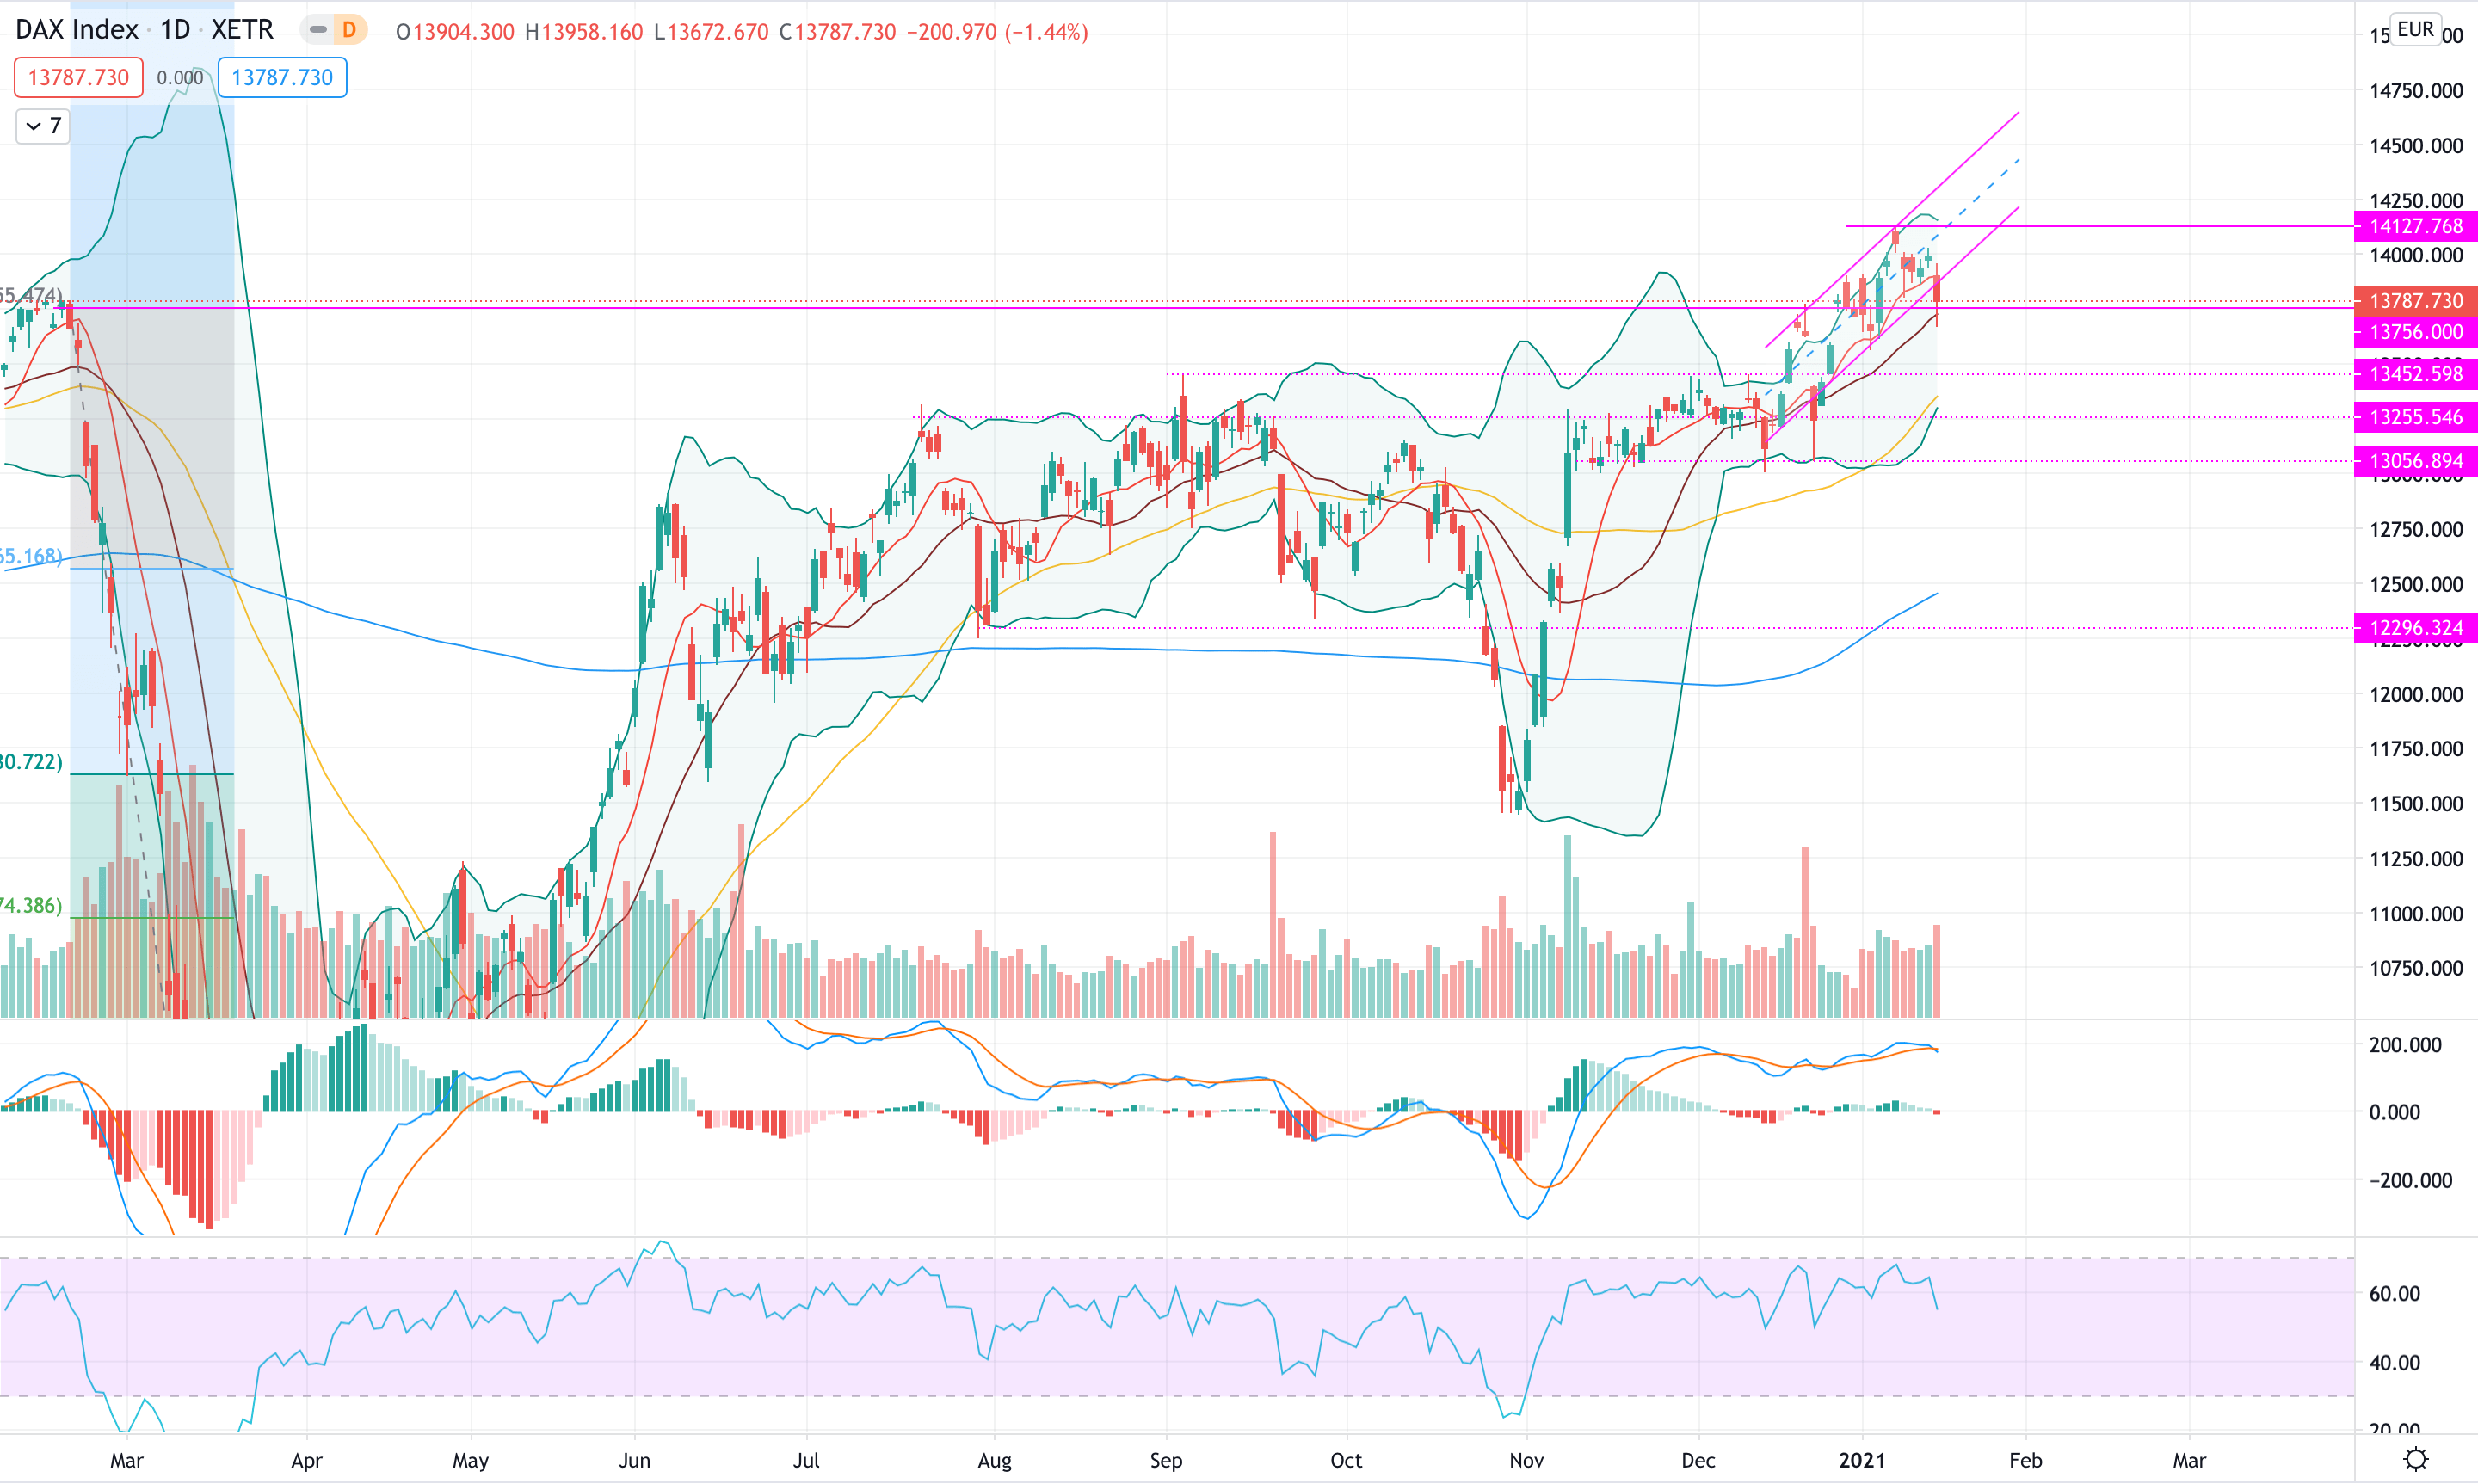
The DAX is now between current support and the 9MA

FTSE 100 (#UKX)
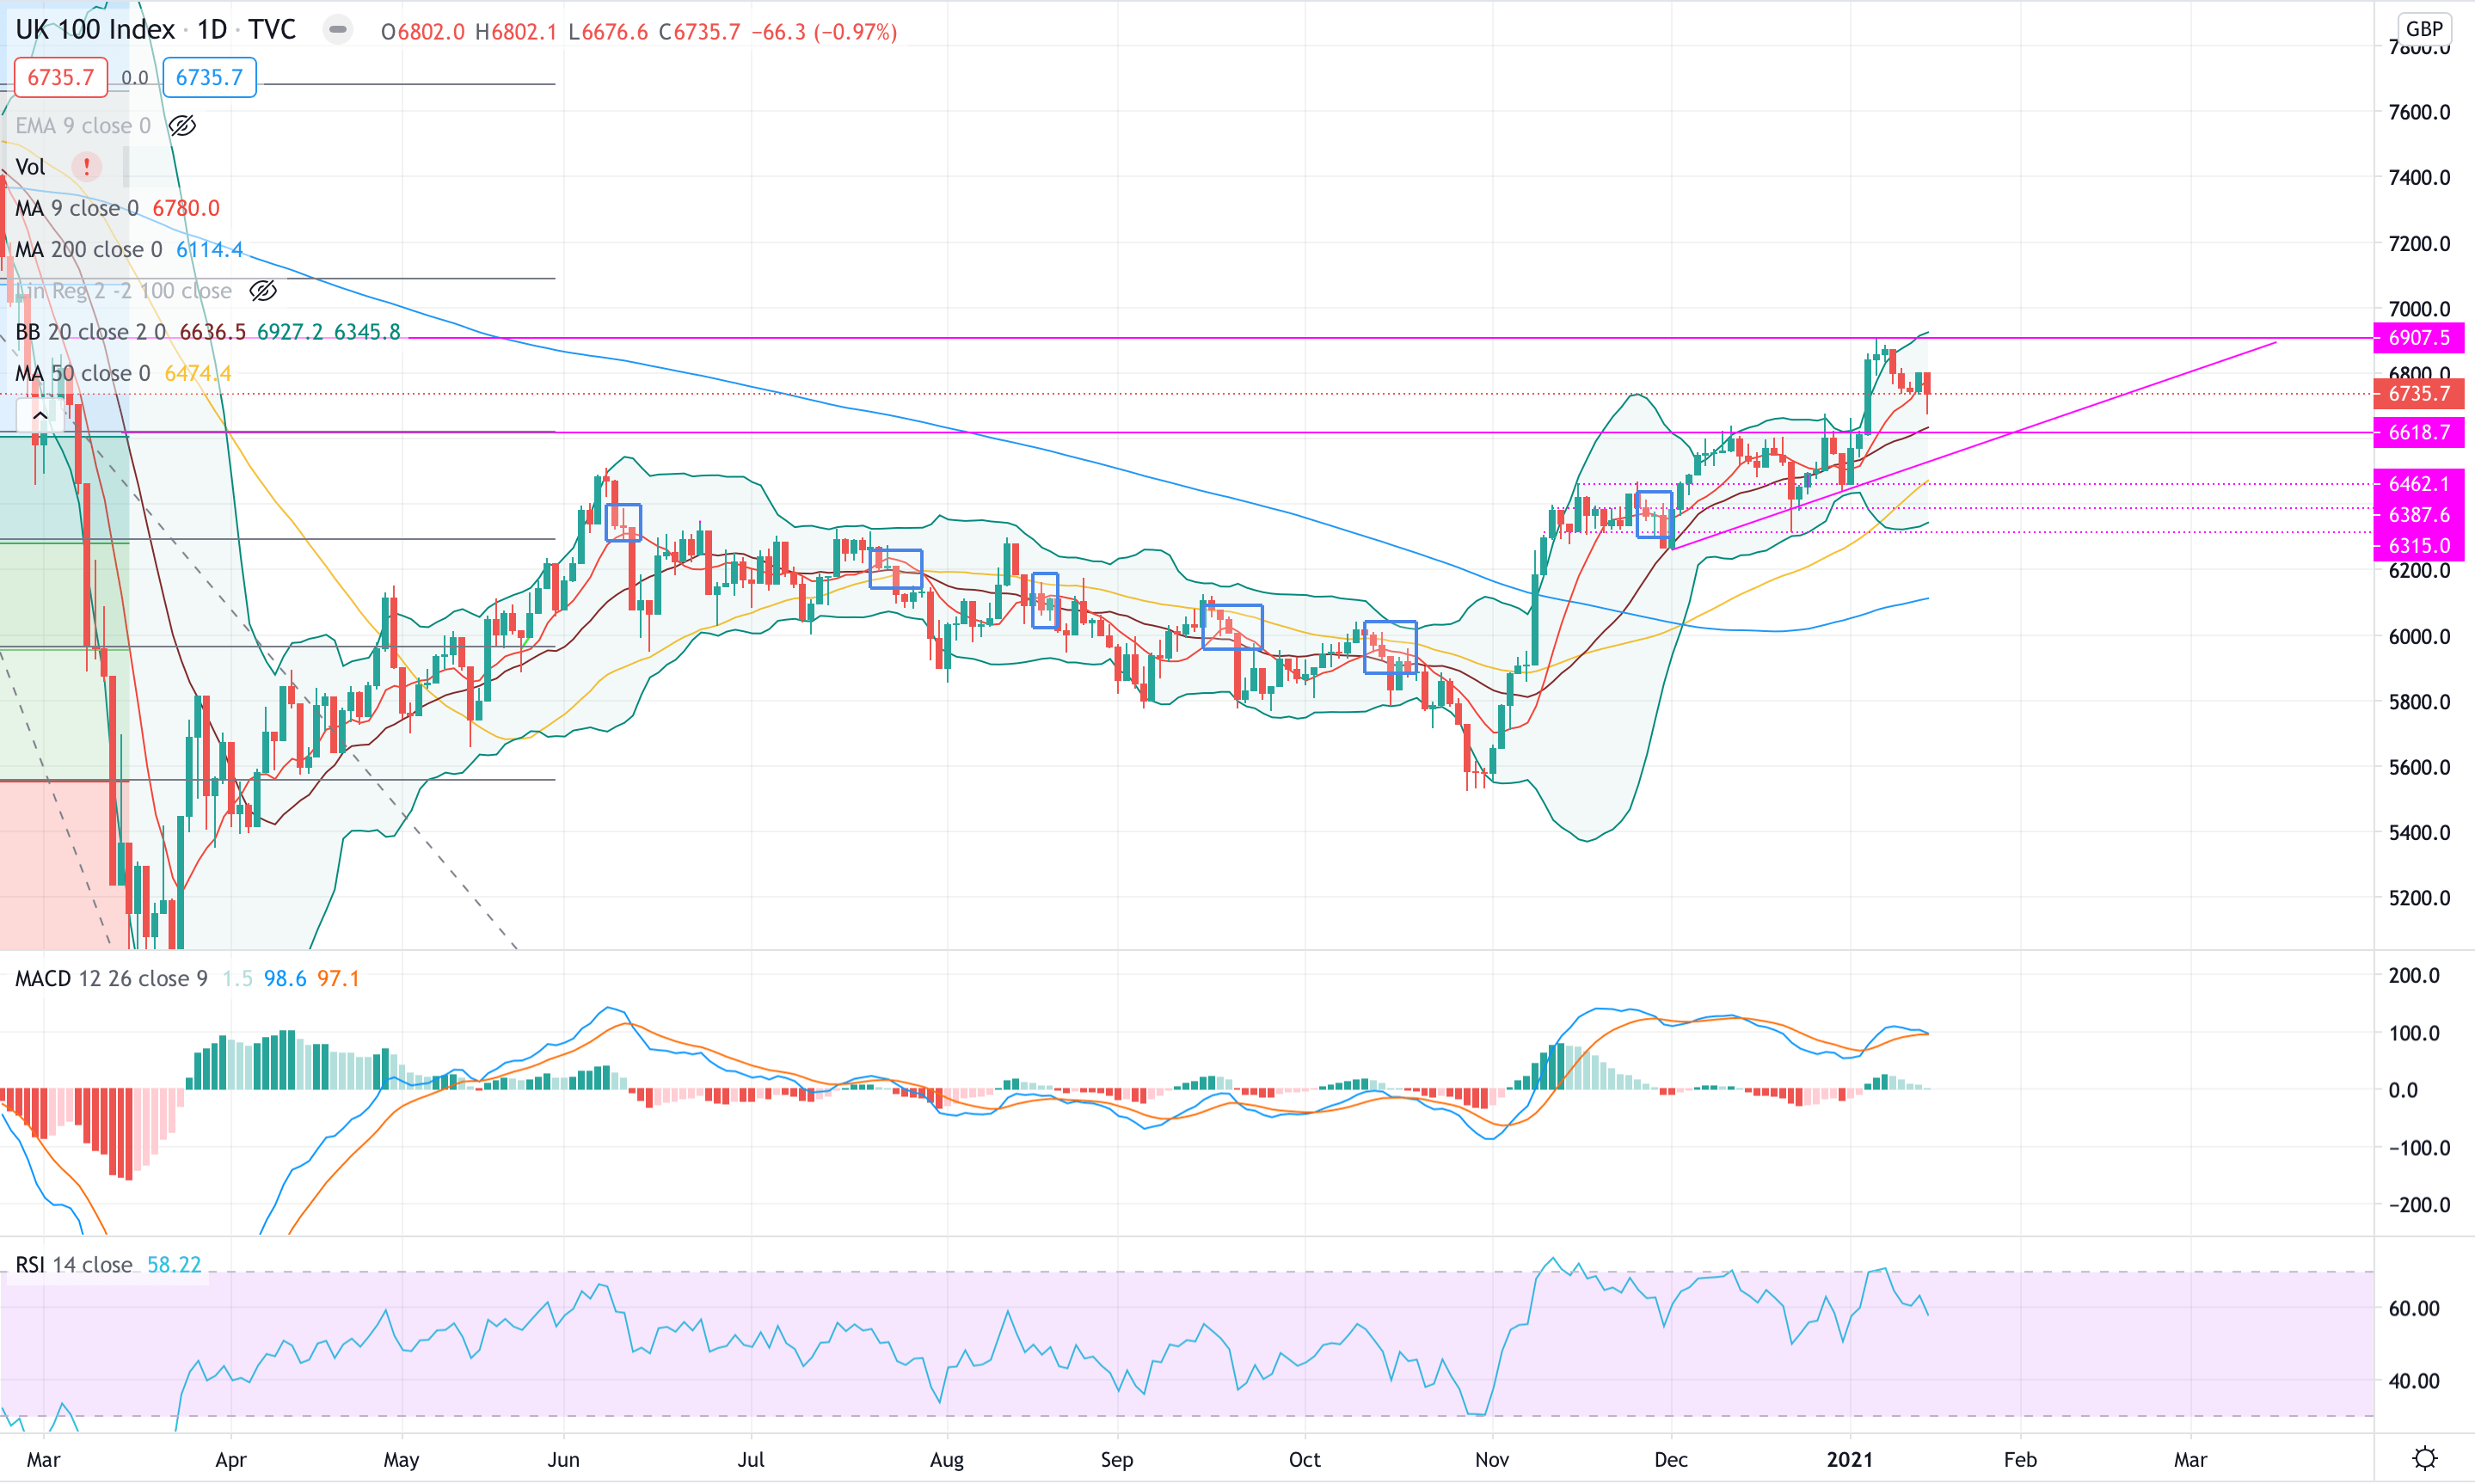
The FTSE had a negative week posting a -1.76% over five days. The move was expected as highlighted last week. The #UKX bounced back from the 6,680 that marked intermediate support for the period.
From a technical perspective, it is important to stress how the #FTSE closed on Friday below the 9MA: this can be relevant as it could sign a continuation to the downside, together with a MACD that is approaching a crossover. In addition, the RSI is retracing from overbought territory.
For the coming week, we might see a slight move to the upside given the Friday hammer candle. However the major direction for the coming week we expect to be to the downside: we do expect a retest of support at 6,618 together with an eventual touch of the trend-line.
At present, we confirm support at 6,618 and resistance at 6,907.
DAX (#DAX)
The DAX fell lower this week and manage to get closer to the 9MA, as described last week the proximity of the Index to the MA has been so far a good indicator of where the Index might go next.
From a technical perspective, the #DAX is now between current support and the 9MA. The MACD is pointing to the downside, together with the RSI that is signalling a weaking of the trend.
For the coming week, we might expect a retouch of the 9MA to then eventually continue the run to the downside and break current support level. An interesting level to watch is at the moment the 13,600: intermediate level before major support and 50MA.
At present, we confirm support at 13,756 and resistance at 14,127.
S&P500 (#SPX)
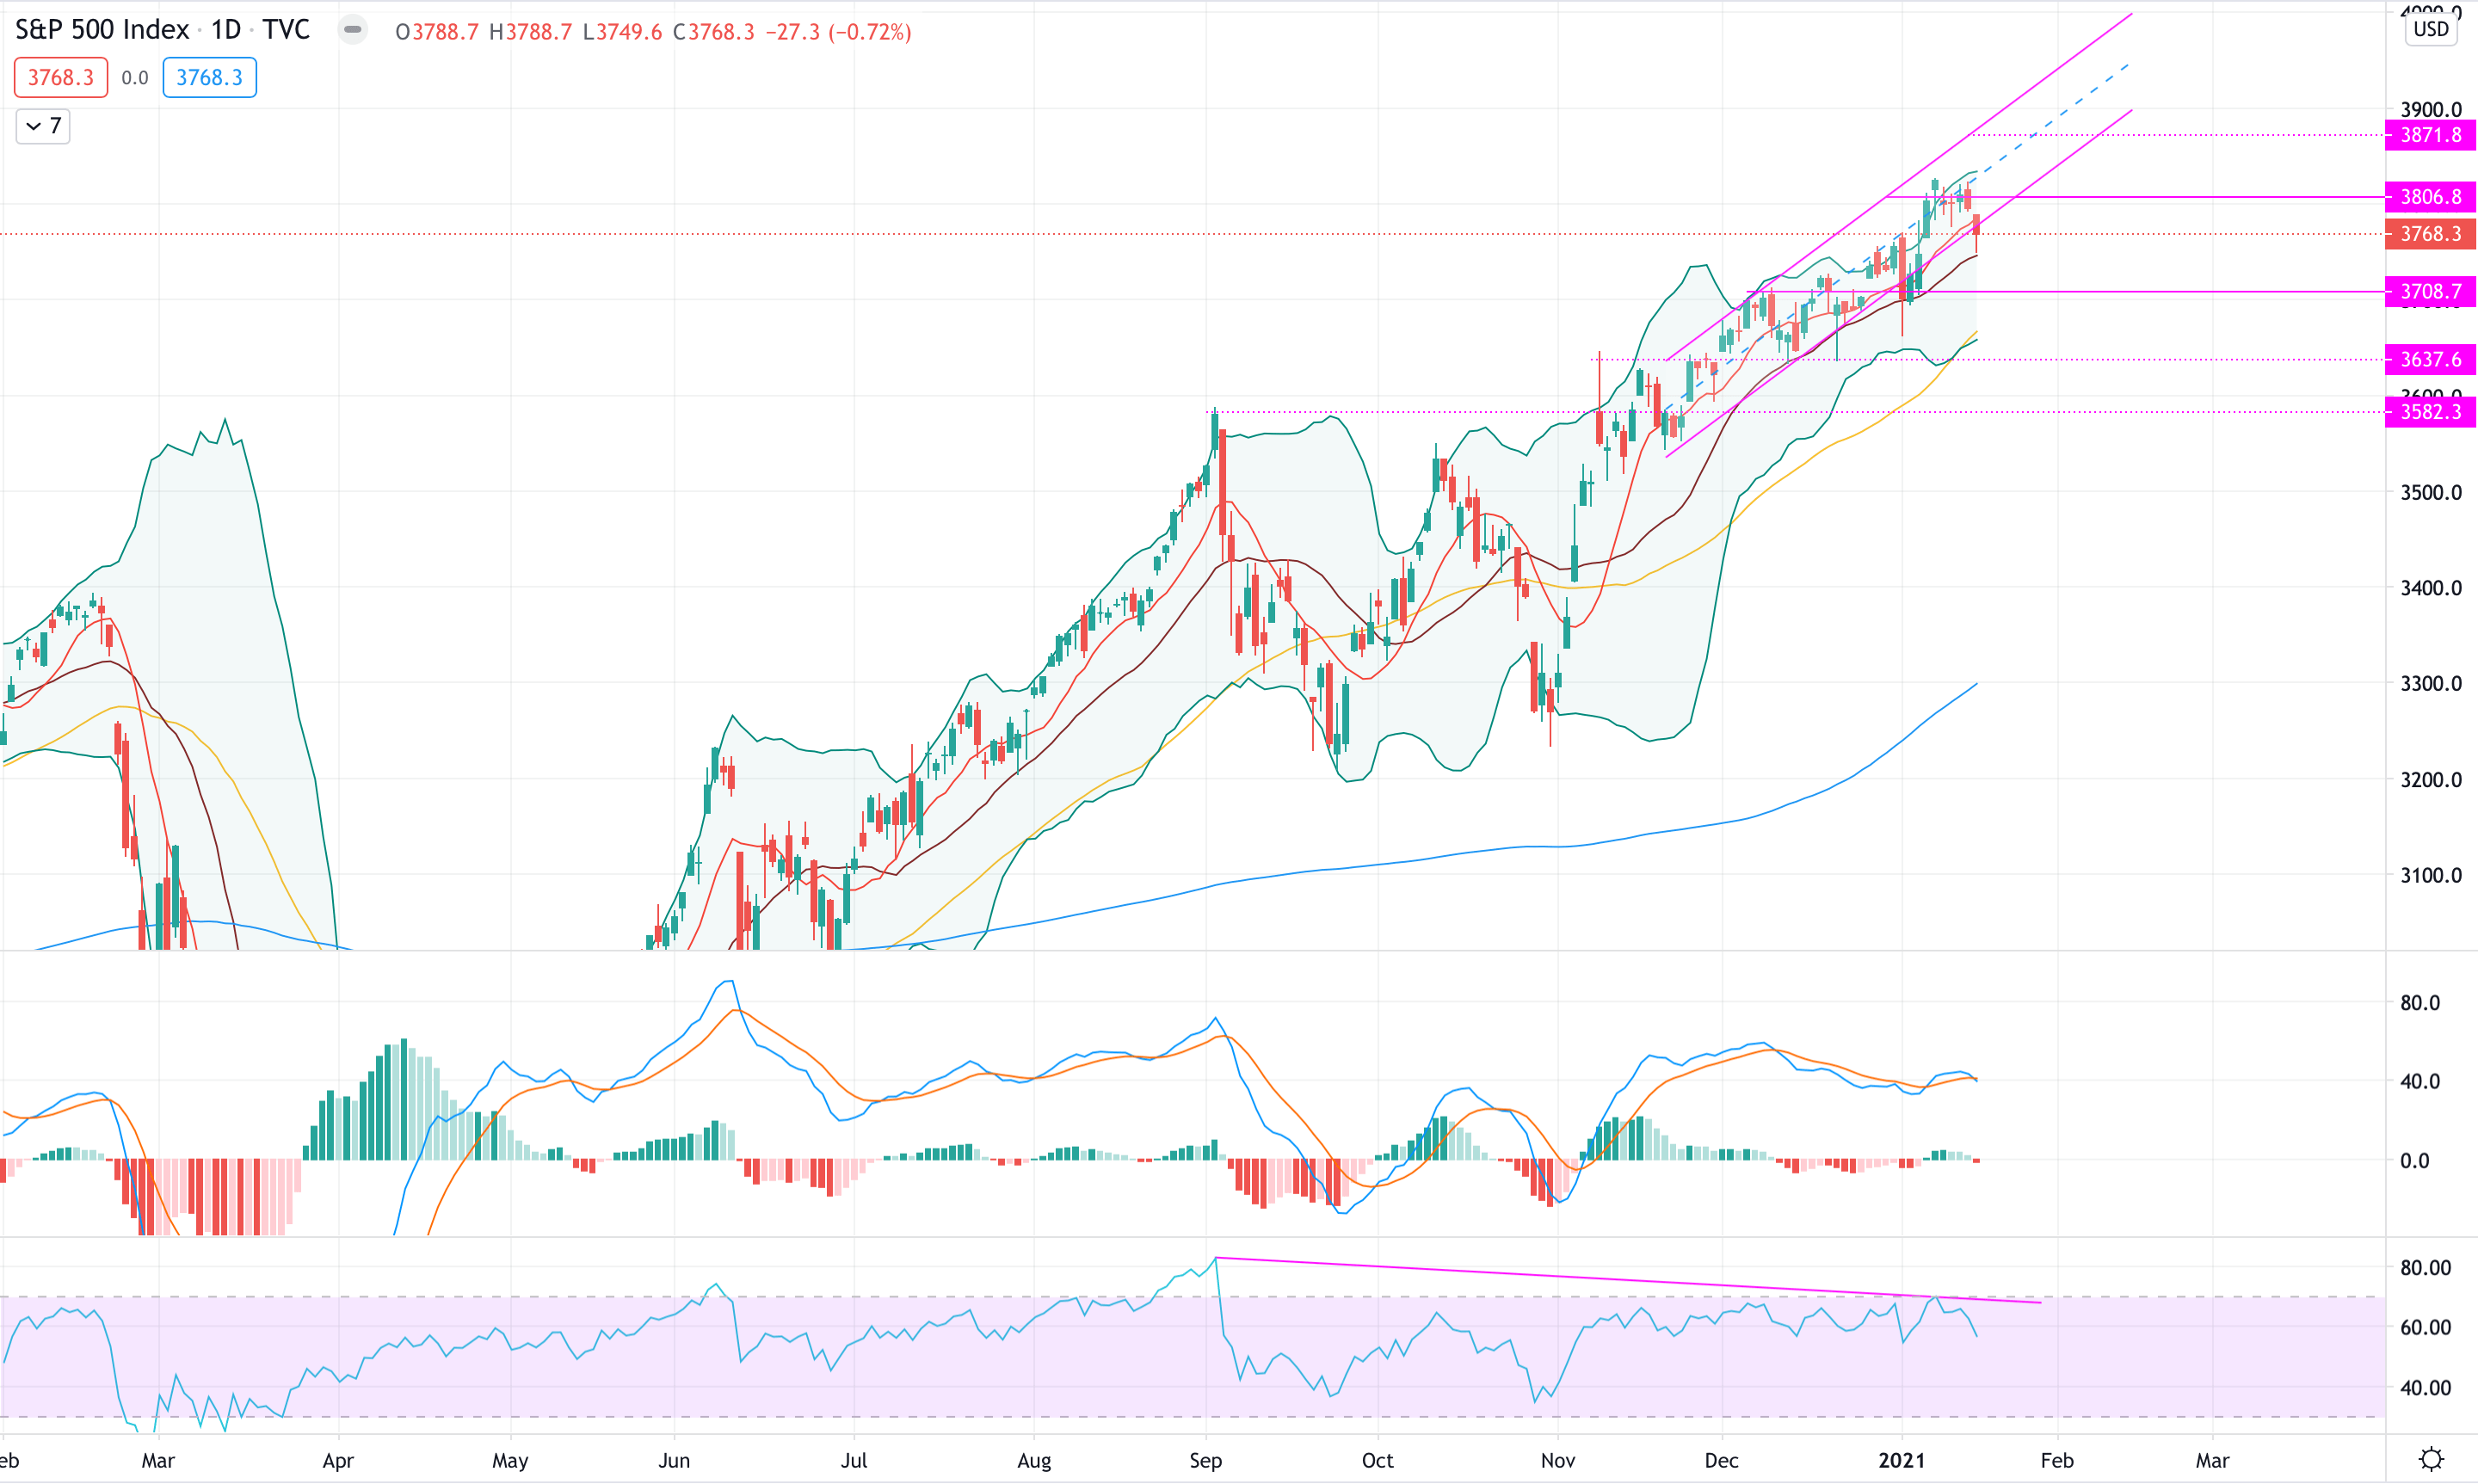
The #SPX had an interesting week as it almost moved sideways to then drift lower on Friday, by closing with an hammer candle.
As it is possible to see, the #SPX is still within the upward channel that it is taking place since end of November: as previous moves suggest, the Index generally goes back again once on the lower side of the channel.
However, given the strength of the last two trading candles we might actually see a continuation to the downside before sharp moves to the upside.
From a technical perspective, the MACD is pointing to the downside together with the RSI that is showing the weakening of the trend.
For the coming week, we might expect a continuation to the downside and a possible retest of support level: given the strong 50MA we however exclude strong moves to the downside.
At present, we confirm support at 3,708 and resistance at 3,806.
Nasdaq (#NDX)
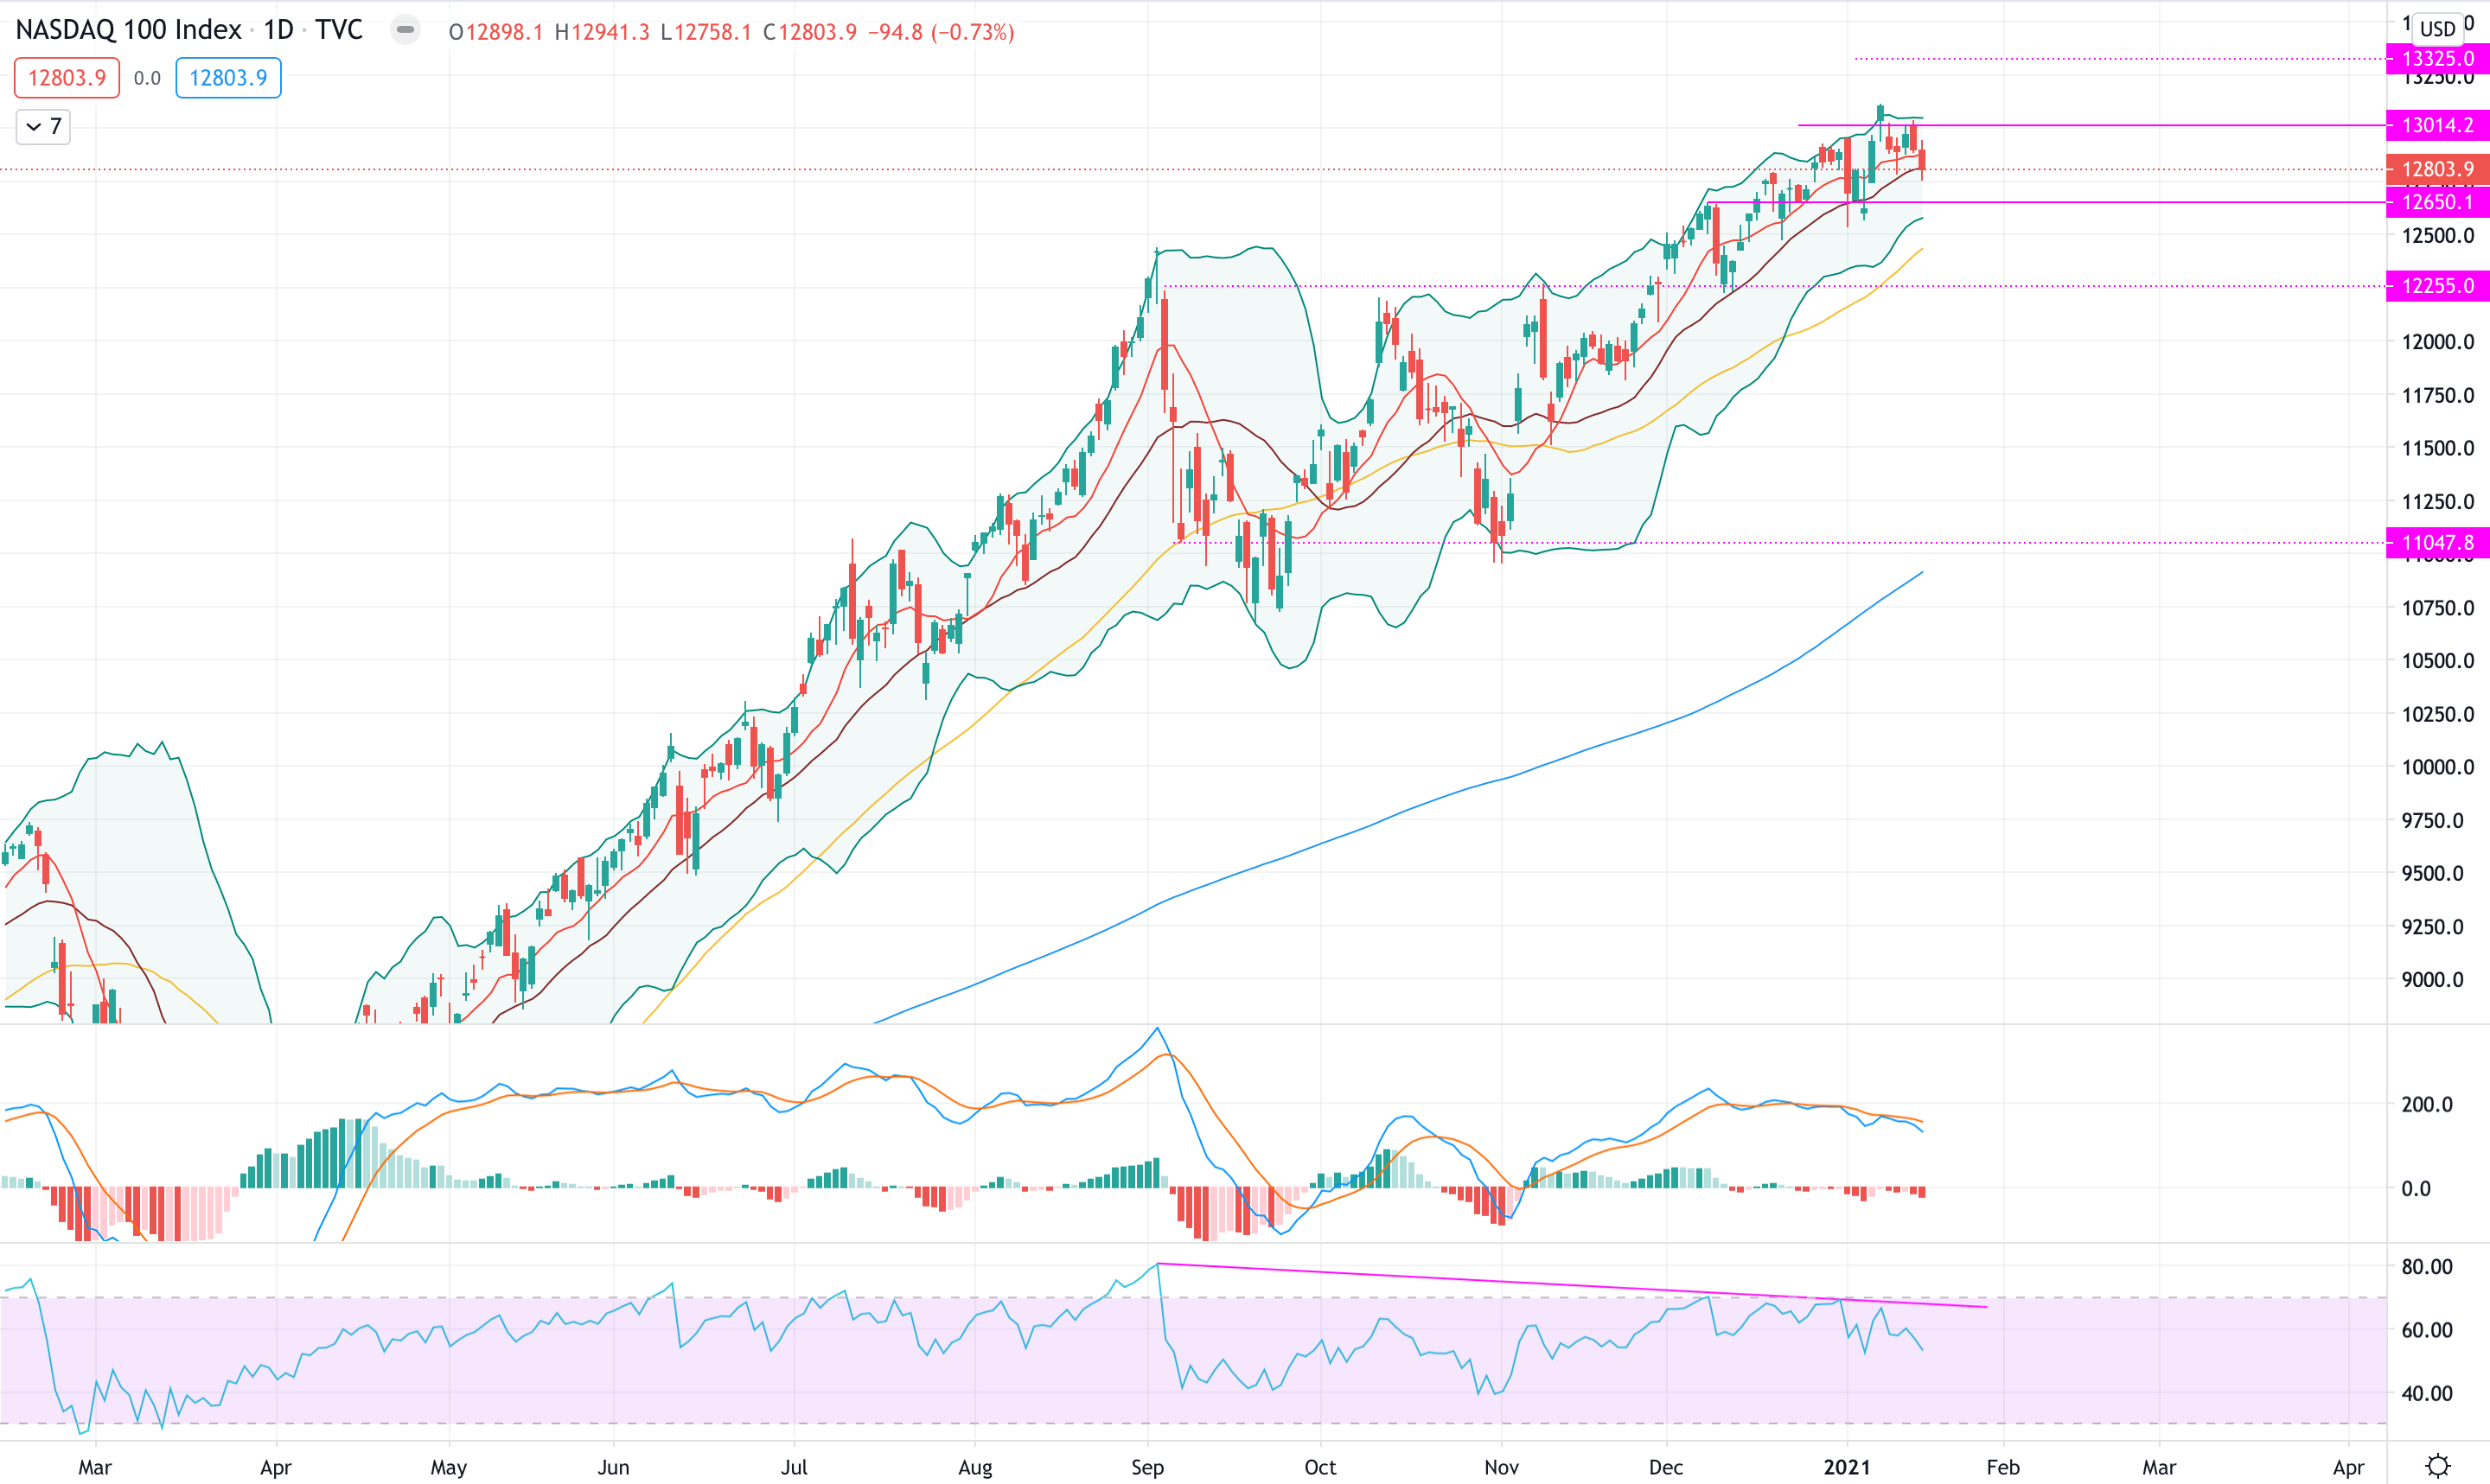
The Nasdaq reversed back quite strongly from the high of last week and re-enter within the major areas where it has been trading since December 2020. The Nasdaq broke the support at 13,014, tested and then moved to the downside overcoming the 9MA. We do believe the #NDX, if it keeps moving sideways, may consolidate within the current channel: the strength of the 50MA remove for the moment the chances of sharp moves to the downside.
From a technical perspective, both MACD and RSI are indicating a sideway move for the near future. For the coming week, we expect the #NDX to move within current parameters and eventually touch support area.
For the coming week, we see support at 12,650 and resistance at 13,014.
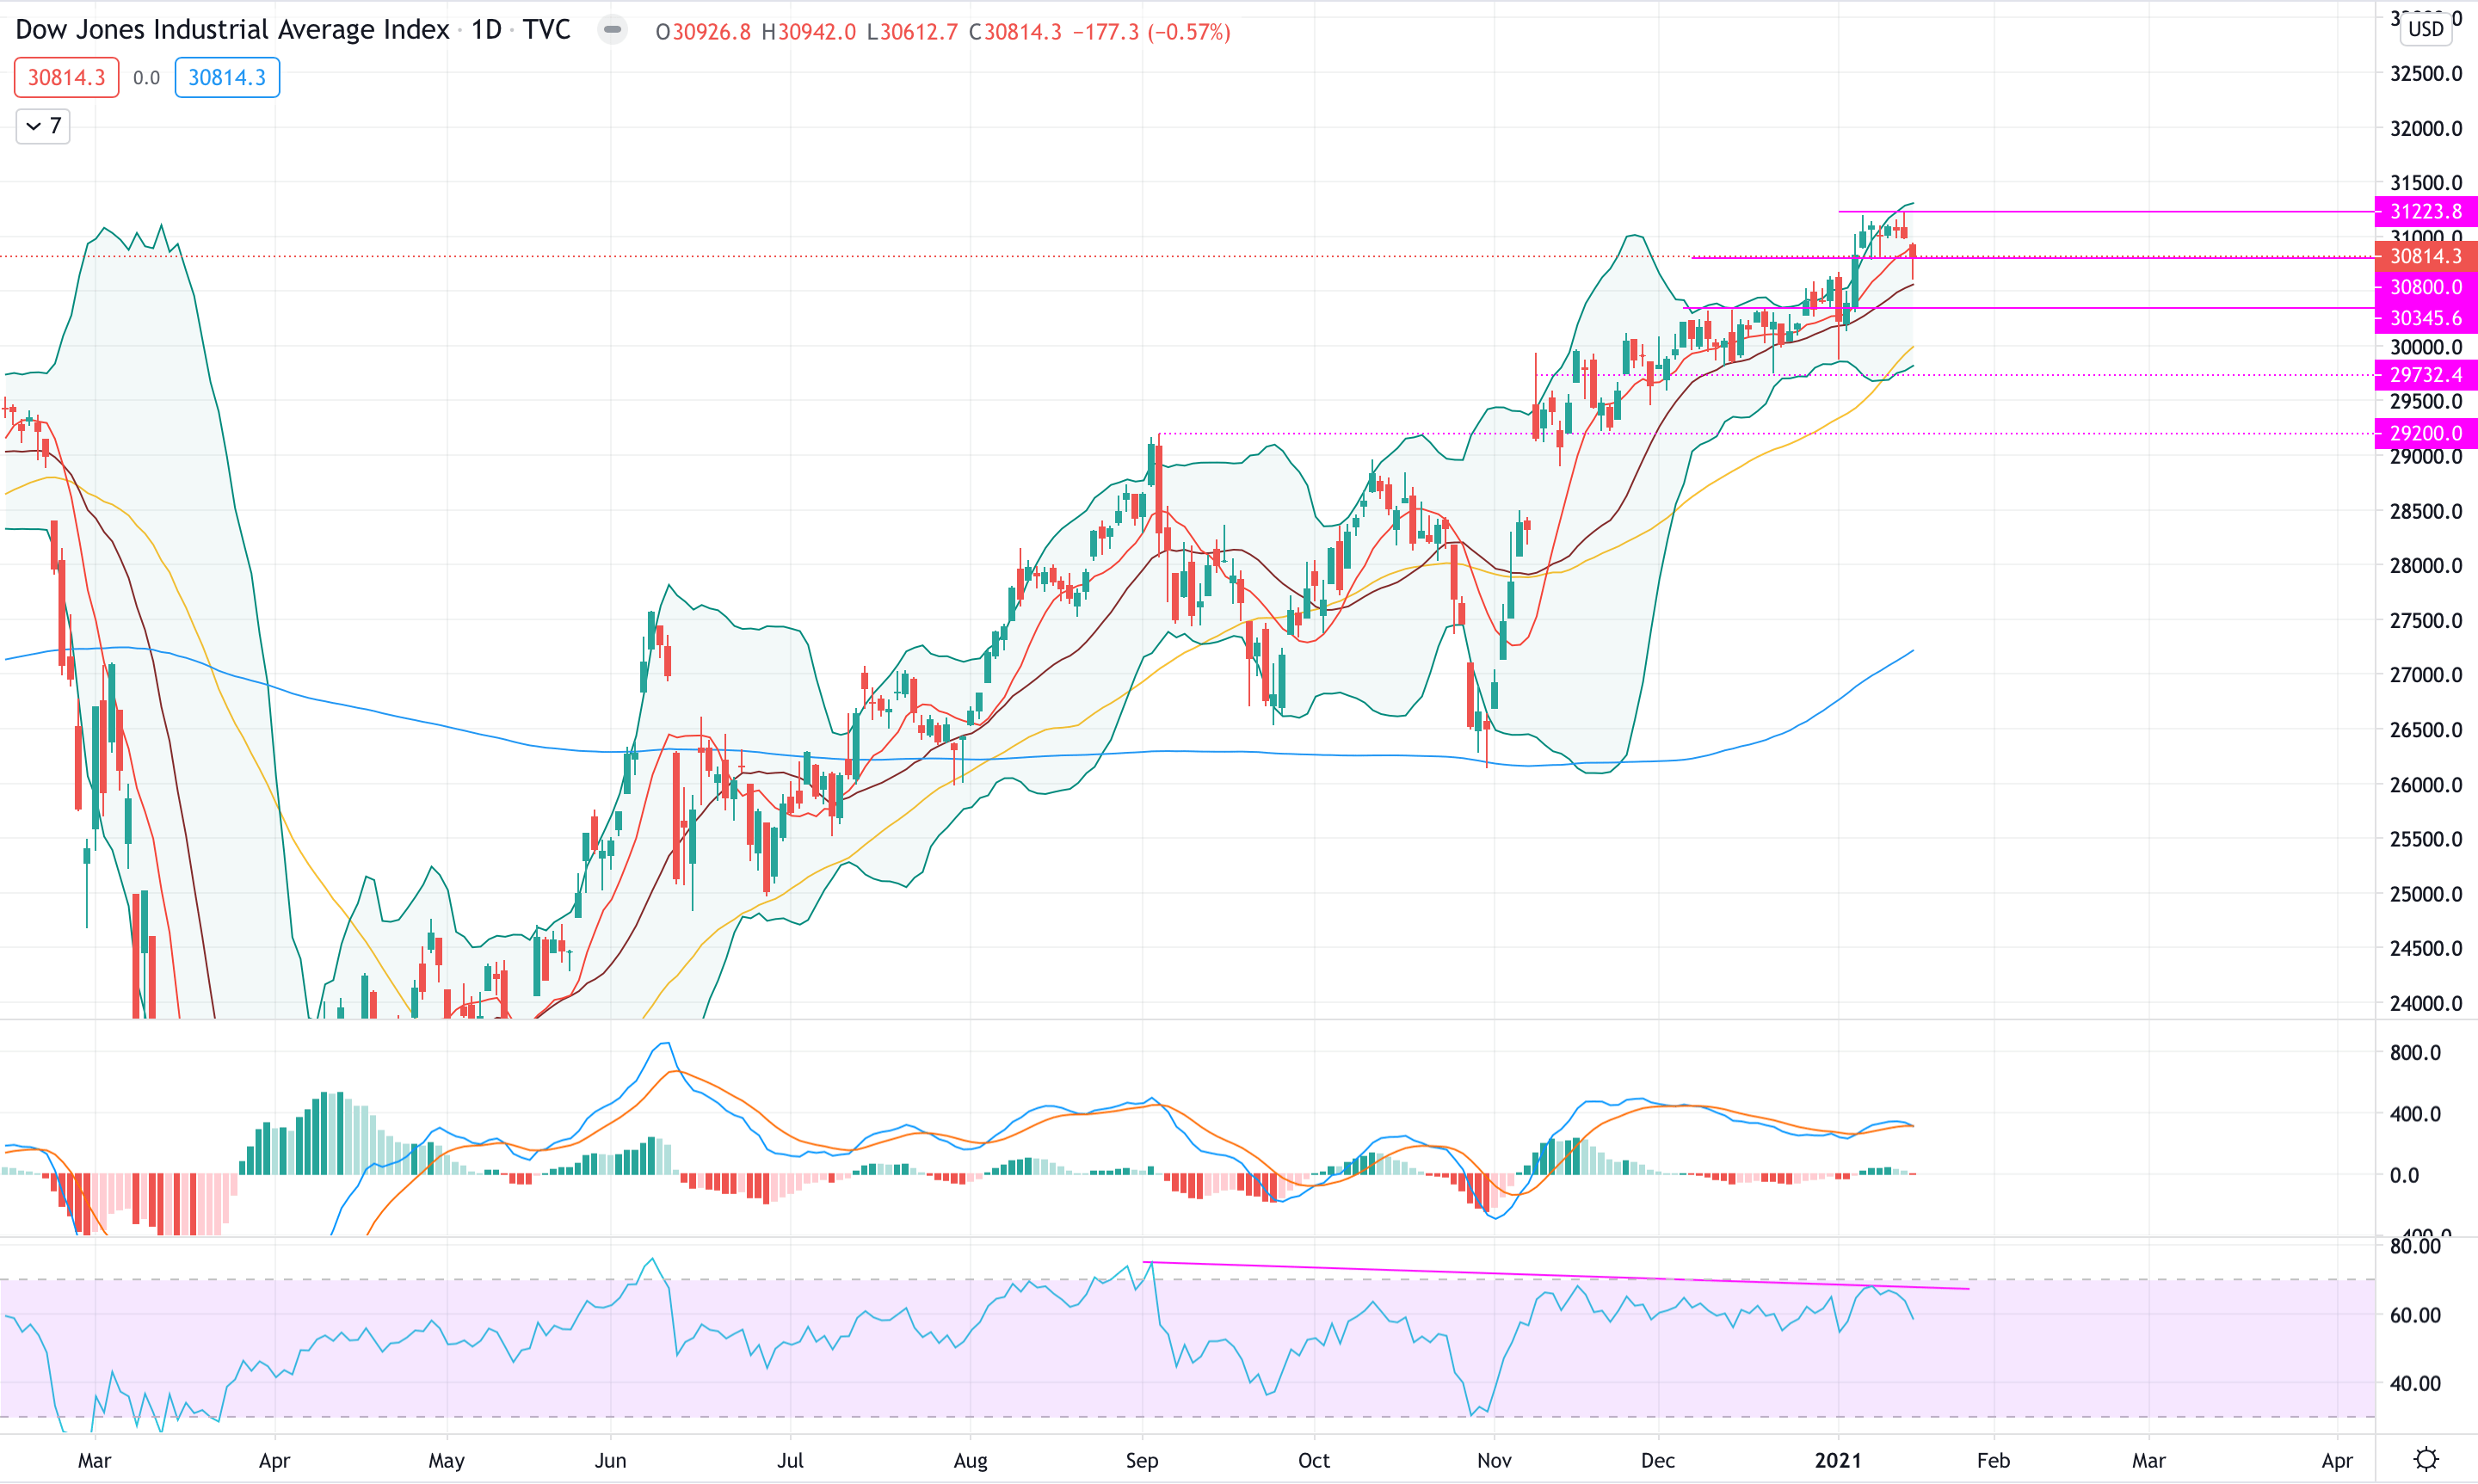
Dow Jones (#DJI)
The Dow moved exactly as expected and finished the week on the current support level: the Index in fact moved sideways for the majority of the week and then sharply moved to the downside on Friday.
From a technical perspective, given the last three bearish looking candle, together with MACD that is signalling a crossover an RSI that shows a weaker trend, we might expect the #DJI to keep moving lower. Based on the current 50MA, we believe there will not be sharp moves to the downside but either a re-test of previous support area at 30,345.
Considering how the Index closed on support level, we give for the coming week two zones:
Support at 30,800 and resistance at 31,223
Support at 30,345 and resistance at 30,800
However, we are more in favour of the second setup.
Author

Francesco Bergamini
OTB Global Investments
Francesco, BSc Finance and Msc in Business Management, graduated with Merit, is a professional with experience in the financial services industry and a keen interest in the financial markets.


