The Daily Fix- Charts to set the tone this week

After last week’s volatility shock to markets, we start the week on a negative tone, with broad weakenss through Asia and the ASX 200 falling out of bed. The weekend news flow has centred on a lack of progress in the Brexit negotiations, a deterioration in Saudi/US relations, which have resulted in a 1.1% rally in crude, and the loss of majority for the CSU party in the German regional elections. Locally, another soft property auction result in Melbourne and Sydney is also a definite talking point.
It’s been a mixed bag in G10 FX markets, where, unsurprisingly, GBP is the underperformer, while the CHF has performed well, helped by better safe-haven flows. The PBoC fixed the CNY mid-point 34 pips higher at 6.9154 (the 10th consecutive higher fix), and the highest levels since January 2017. But, rather than the usual narrative, I feel charts can paint a clear picture, so I have put some of what I think are the most important charts for setting the scene this week.
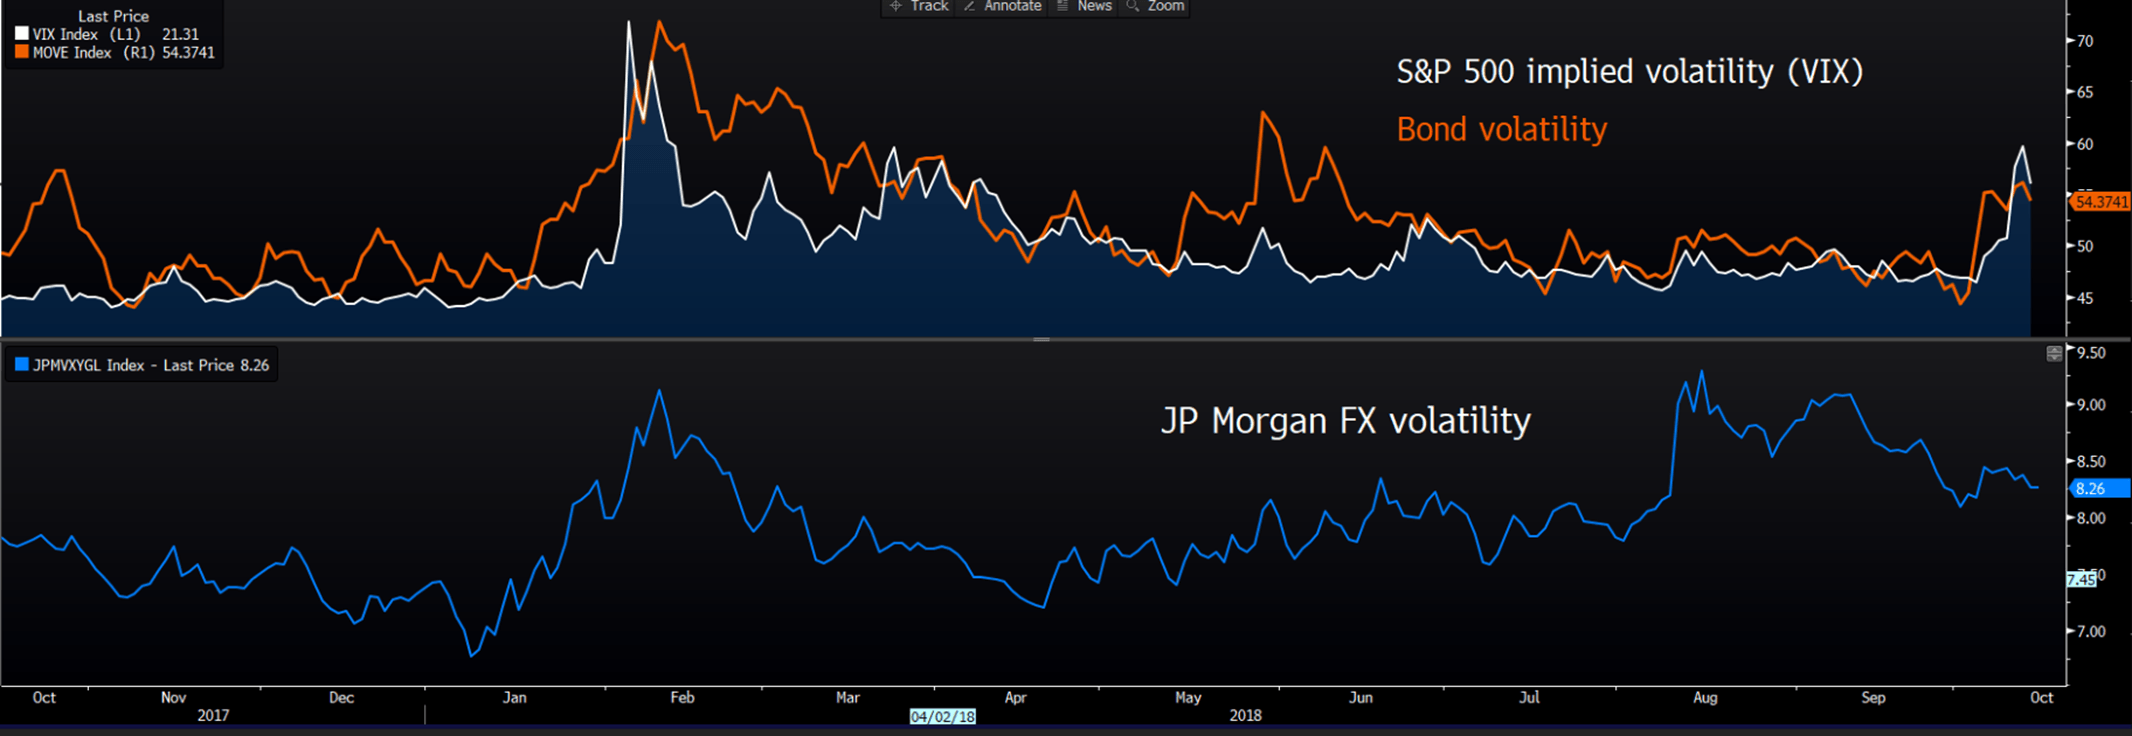
Volatility
As we can see from the Bloomberg chart, the significant increase in implied volatility has centred in bond markets (I use the BoA/ML ‘MOVE’ index) and the S&P 500 (‘VIX’ index). We can see through the recent pick-up in risk aversion that implied volatility had been prevalent in bond and equity markets, but volatility in FX markets has fallen. For traders wanting to see realised volatility, perhaps the best way to see this is by applying the five-day ATR (Average True Range) to the chart.
(All charts sourced from Bloomberg)
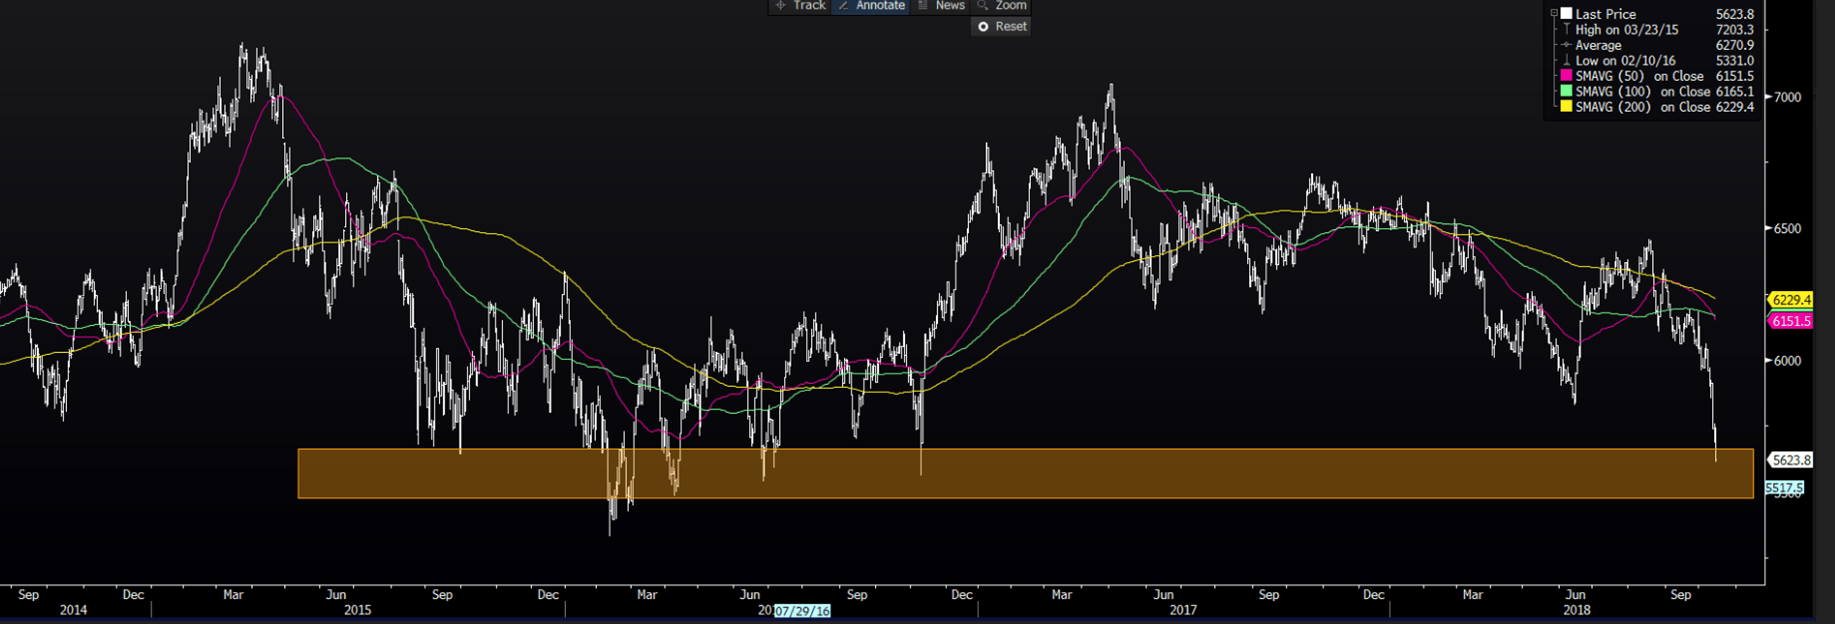
The ASX 200
A lot of focus on the moves in Aussie banks, as the sector commands a 31% weighting on the ASX 200 and is taking 33-points out of the index today. As we can see from the daily chart of the ASX 200 financial sector, the trend is firmly lower here, with price holding below the 5-day EMA and as we can see, the longer-term moving averages (the 50-,100- and 200-day MA) are almost aligned and heading lower. Horizontal support is in play, but there are few signs in the price action to suggest a technical bounce is an elevated probability. The focus has to be on the Aussie housing market, with house prices impacting sentiment to hold bank equity, and with another weekend of auction clearance rates running below 50% in the key capital cities, banks are down hard here.
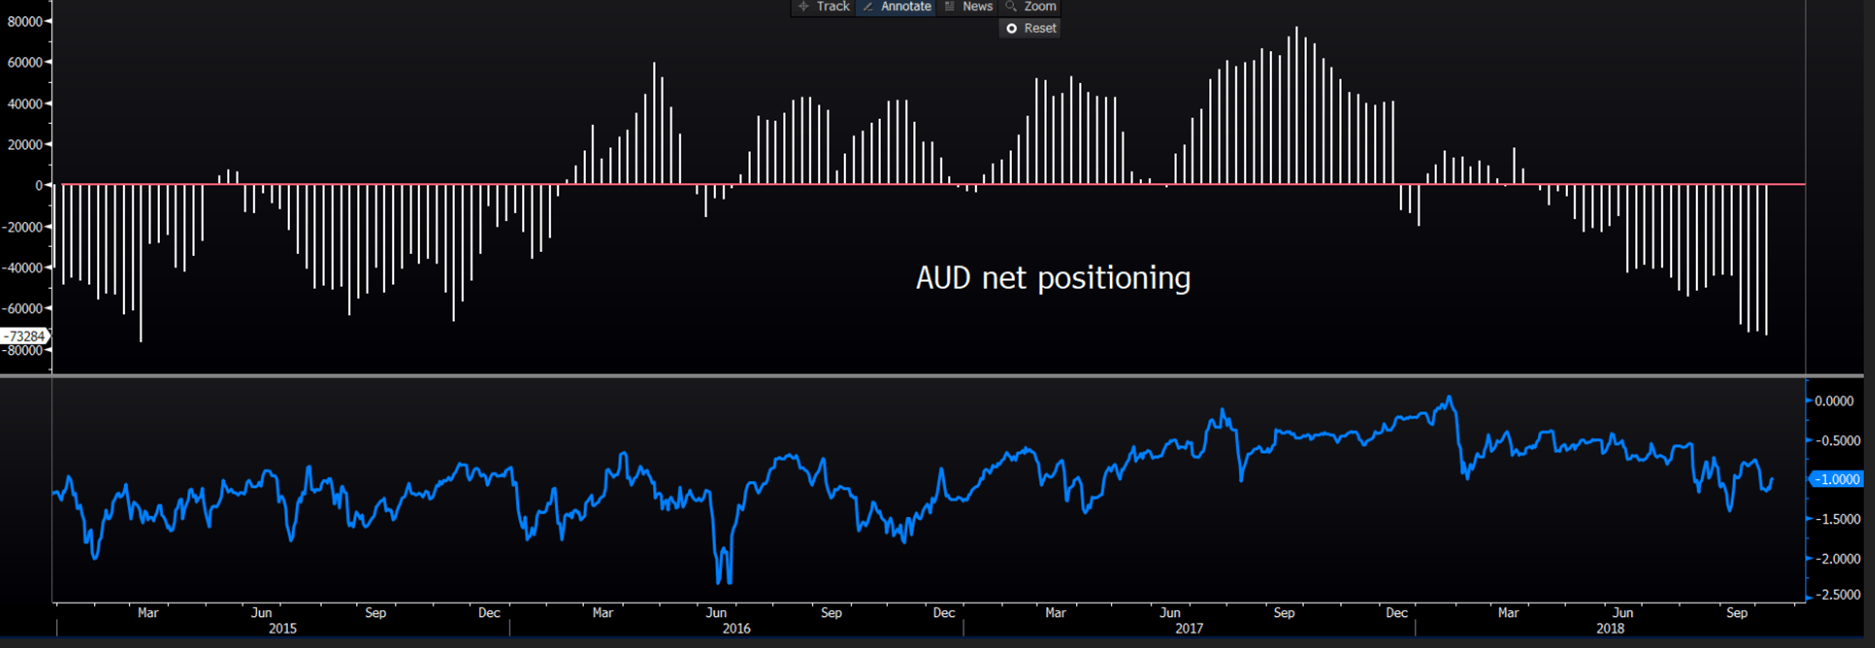
The pair is down smalls here and testing the 71-handle, and the housing theme prevalent in the ASX 200 should be playing into the AUD to a greater extent. There have been limited moves in the Aussie rates markets, which is surprising, but traders are buying Aussie bonds across the curve, with a three-basis-point flattening of the 2s10s bond curve. As we can see from the weekly CFTC data, the speculative trading community increased its net short position last week to 73k contracts – the most since 2015, but consider that this was the reported position as of Tuesday. The lower pane (blue line) looks at AUDUSD one-month ‘risk reversals’, which measure the skew of out-of-the-money ‘put’ options to ‘call’ options. Here, we see a far more neutral position. Rallies in AUDUSD are still to be sold in my opinion.
China
A big week of economic data to focus on, with CPI/PPI due tomorrow and Q3 GDP (consensus sits at 6.6%), industrial production, retail sales and fixed asset investment due Friday. As things stand, the Hang Seng is lower by 1.1% today, but the weekly chart highlights the key support level by which the index resides. A break here could get ugly if it isn’t already and the bulls need to support here.
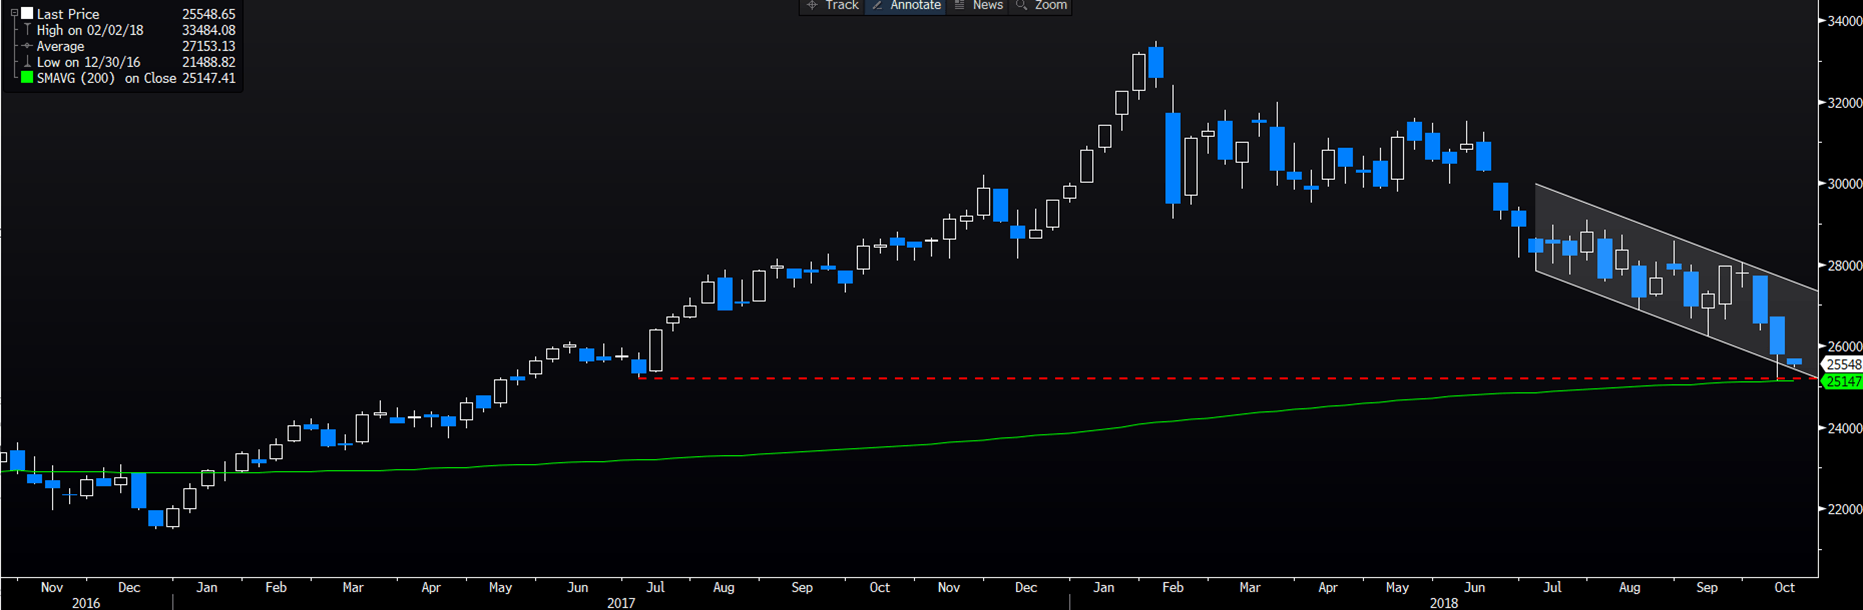
S&P 500 futures
A chart that is getting a bit of airplay of late and perhaps the direction comes from the VIX index and how invested funds can be given the level of implied volatility. However, we can see a limited move today despite a weaker session through Asia, with price consolidating in a short-term triangle pattern and oscillating around the 200-day MA. It's hard to be too bullish until the price has closed back above the 5-day MA (green line) and implied vols (VIX) heads lower. The weekly chart shows price holding the 55-week MA, so a weekly close this week through 2731 would be bearish.
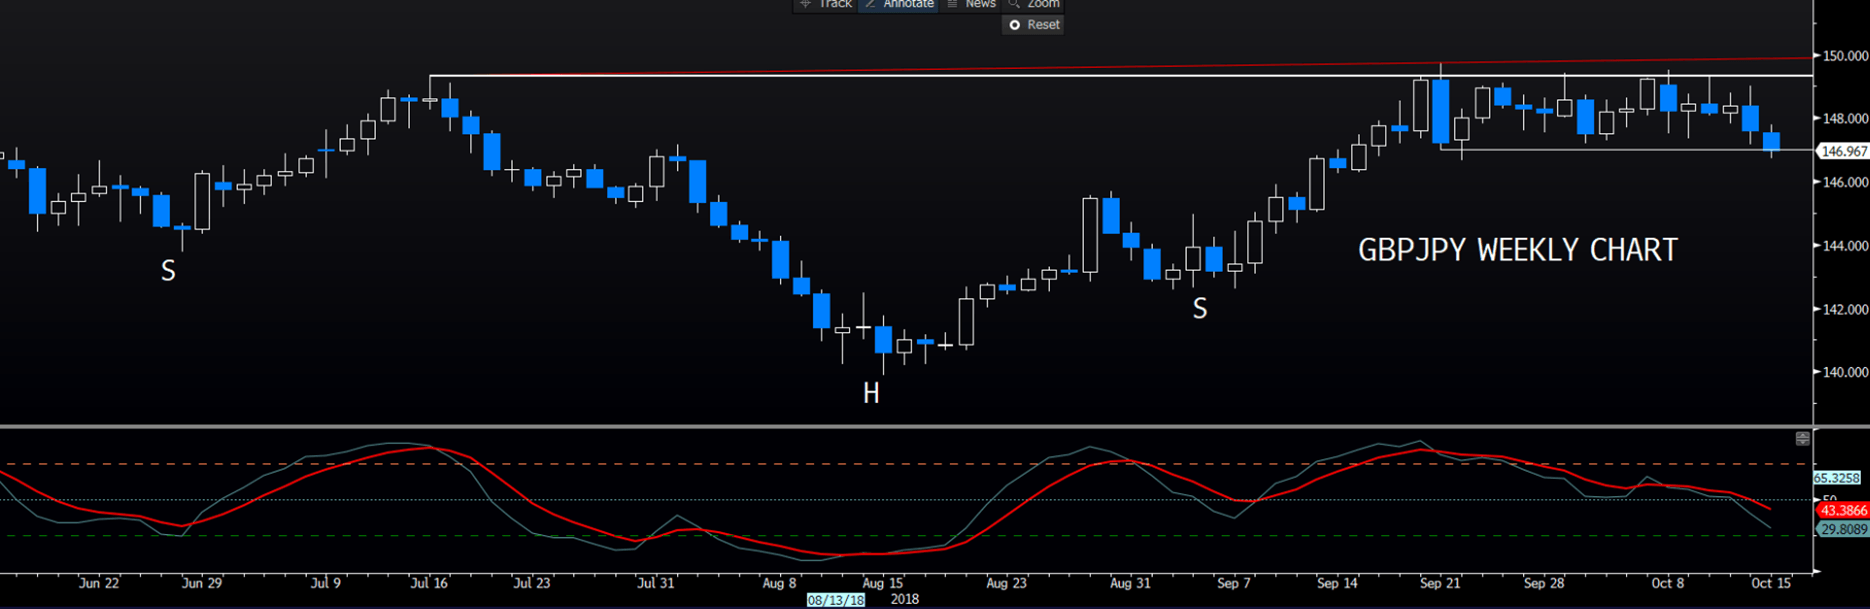
Brexit negotiations
A massive week for talks between the UK and the EU, with the news flow taking a sour turn this morning, amid headlines that a draft treaty to see Britain exit the EU was a ‘non-starter’. Ireland is still the point of contention, as it has been for some months, and how this is resolved in somewhat unclear. With the EU Summit on in focus on Thursday, failed talks this close to the critical summit is not a great look, but my view is that this is classic Brinksmanship, and we should still see a deal away this week, but they have to make it look that it wasn’t easy to come by. GBPJPY has been the trade on my radar, and I am still waiting for a break of either boundary on the weekly to suggest a new trend is due. Happy to stand aside and let the market push me into a trade.
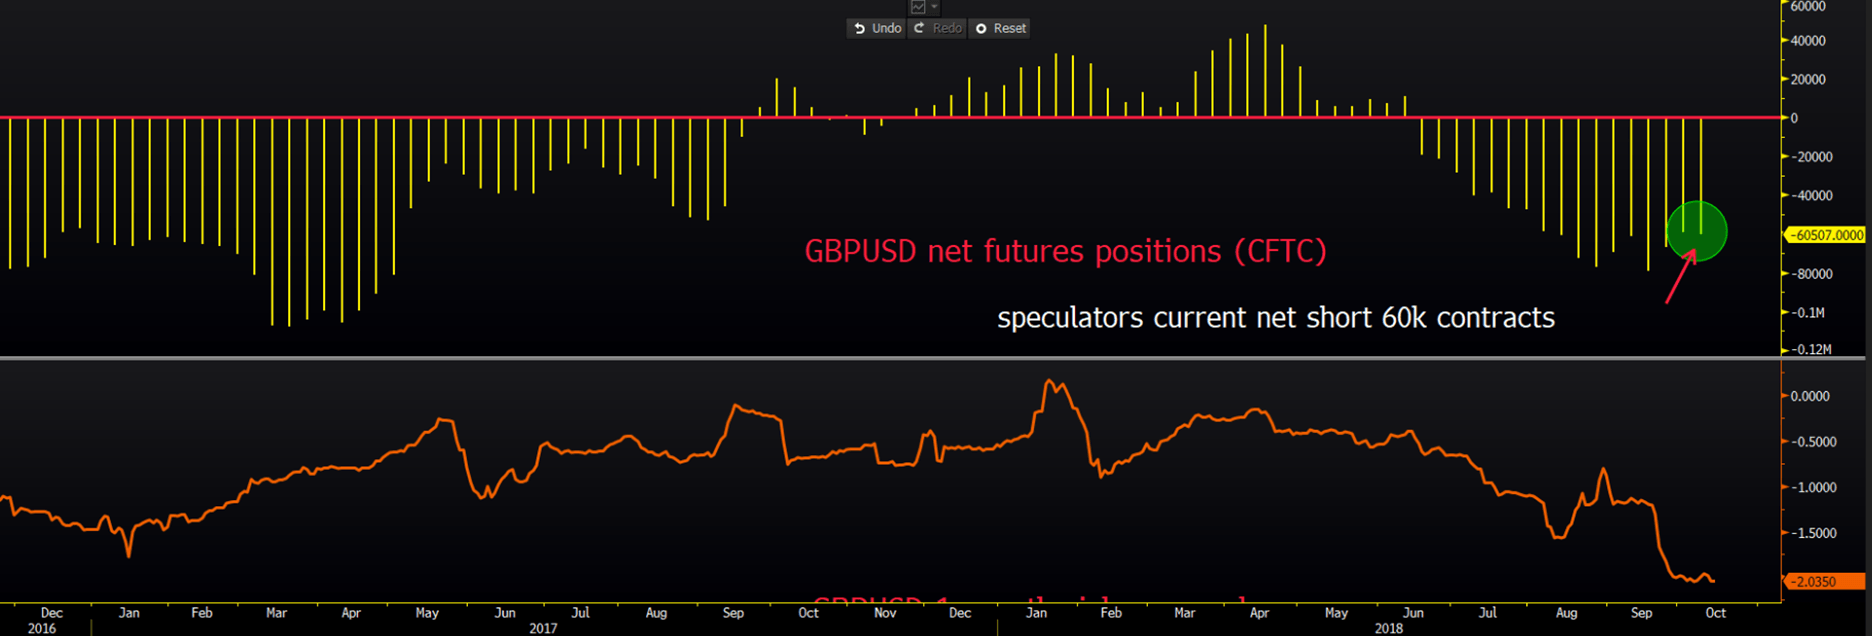
GBP positioning
Some reduction of GBPUSD shorts of late, to what is a somewhat more neutral stance, although as we can see from the lower pane (the GBPUSD three-month risk reversals), we can see options traders have the most bearish stance on GBP since 2016. Tactically, it feels like a deal is still in the works, but it will be tough to pass through the Commons. It feels as if there will be a moment when all hell breaks loose and we peer over the cliff, with GBP coming alive. In my opinion, that is the time to buy GBP as the political system in the UK and EU is designed to come together if genuinely pushed.
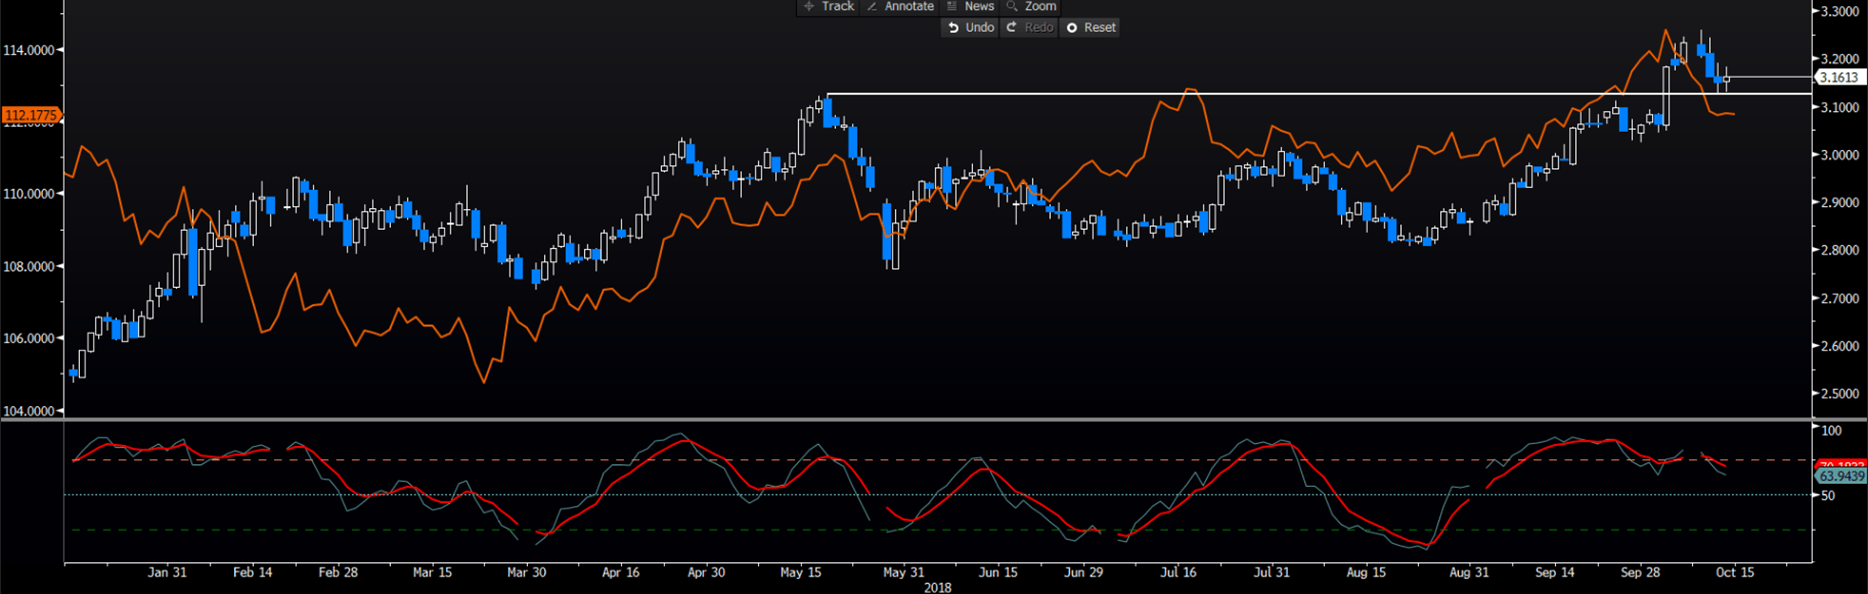
US Treasuries
As we can see from the Bloomberg chart, USDJPY is influenced by the US fixed income market. I have been heavily focused on the 30-year, and traders’ appetite for real duration assets. But, the 10-year Treasury is at such vital levels here. Sellers have come in of late, keeping yields above 3.12%, and while stochastic momentum suggests we could see this crack at any stage, if the sellers kick in here then it would confirm what was support in yields (resistance in price) is now resistance. If the market bought S&P 500 volatility partially on the idea of higher bond yields, then if yields do head lower through 3.21% and volatility also heads south, and we could see US tech stocks outperform.
Author

Chris Weston
Pepperstone
Chris Weston recently joined Pepperstone as Head of Research.


