The Chart of the Week: Gold price remains under pressure at key resistance
- Gold prices are trapped on the weekly time frame, but bears lurking at resistance.
- The four chart offers a slightly bullish perspective.

The price of gold, as forecasted in the prior analysis, has been into to test the key weekly support territory in recent bearish moves. However, the following top-down analysis illustrates that the price can now be expected t to correct back towards $1,710 before the next downside move.
Monthly chart

The price is now at key support and would be expected to correct higher at this juncture.
Weekly chart

The weekly chart is a clearer perspective of the thesis.
Daily chart

From a daily perspective, the recent test of the 38.2% Fibo is bearish for the longer-term outlook but support traps the outlook.
4-hour chart
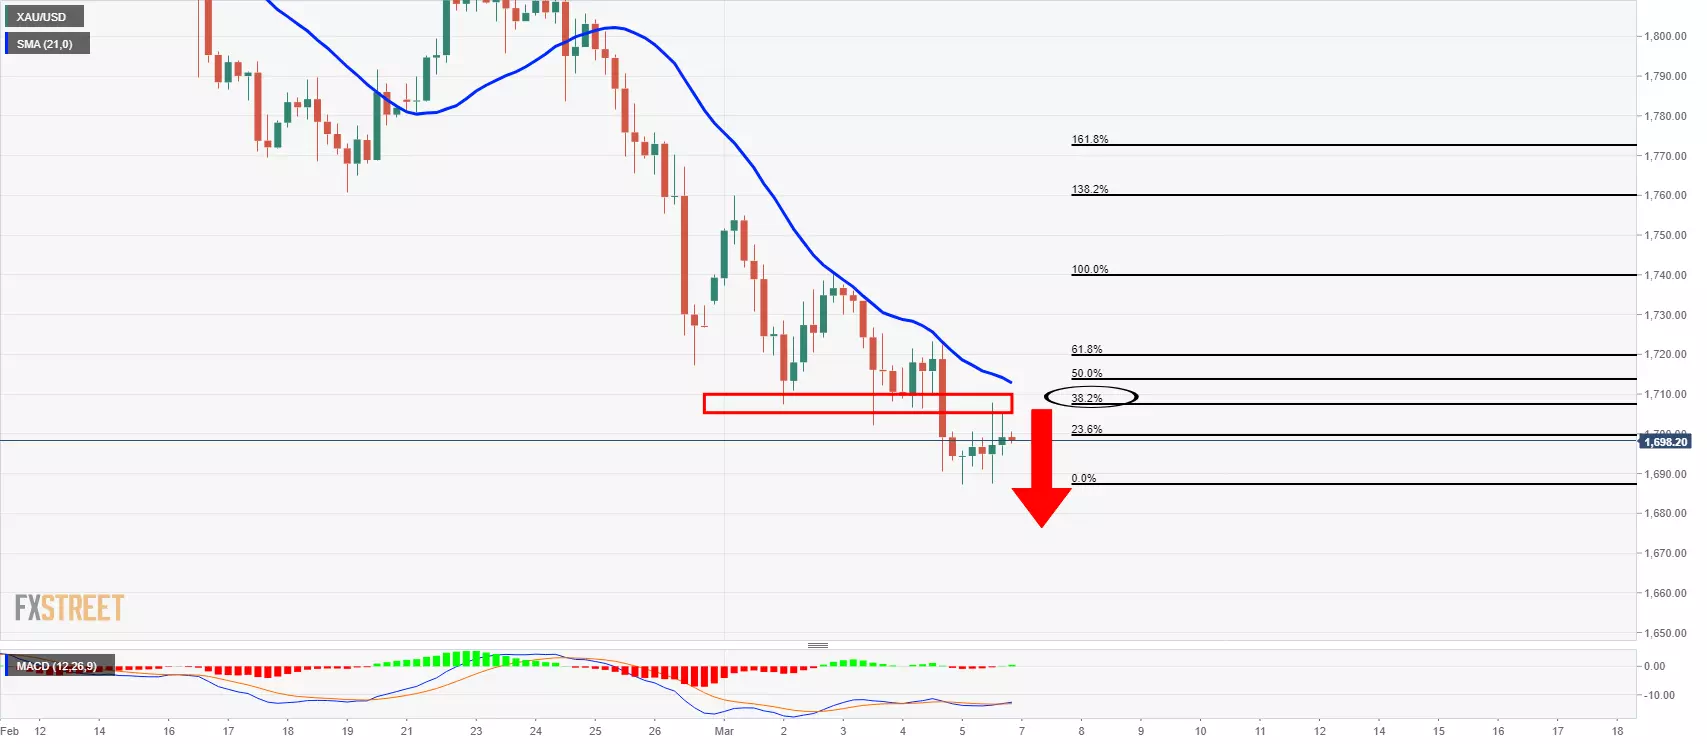
As per the 4-hour chart, the outlook is bearish, but there is every possibility of a deeper and fuller test of the recent highs in the sessions ahead.
Premium
You have reached your limit of 3 free articles for this month.
Start your subscription and get access to all our original articles.
Author

Ross J Burland
FXStreet
Ross J Burland, born in England, UK, is a sportsman at heart. He played Rugby and Judo for his county, Kent and the South East of England Rugby team.


