The Chart of the Week: AUD/USD toppy, H&S could be in the making
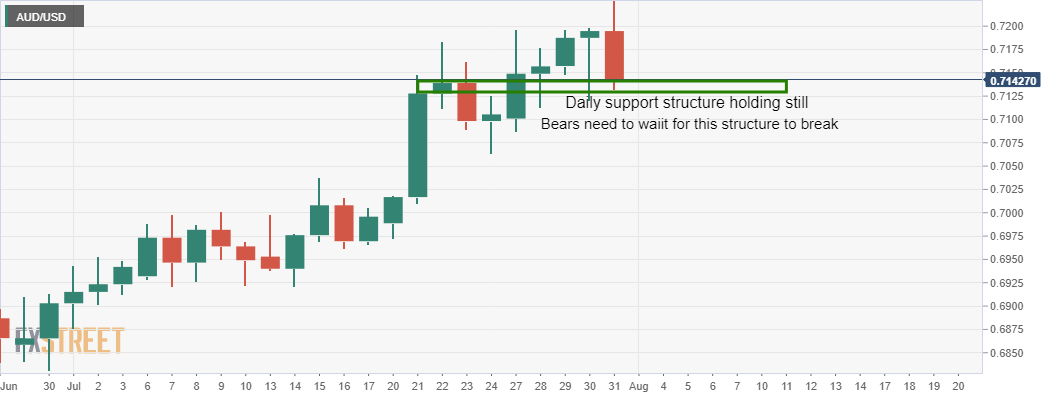
- AUD/USD H&S is in the making so long as bears stay on top at this juncture.
- The US dollar net positioning is overstretched and so too are both daily RSIs and weekly RSIs.

It has been one-way traffic on the Aussie throughout the 11 consecutive days of the US dollar's decline.
There are a number of reasons to worry for the USD bear crowd:
i) Positioning is stretched, USD liquidity momentum remains poor, ii) activity is levelling off and iii) YCC steepener bets are already VERY consensus-like and iv) moreover, printing presses will continue for as long as inflation is not rebounding.
If the euro is the main G10 determining the direction of the dollar right now as its presses through a 12-year downtrend's resistance line, then it is worth noting that last week, ECB member Stournaras indicated that even the pandemic emergency purchase programme (PEPP), will not end until the inflation outlook is firmly back on track, much like the asset purchase programme (APP).
We are not yet still seeing long bond yields which makes a resurgence in the dollar a compelling probability, at least until a reflationary spiral is in place.
This leaves the precious metal's market and the commodity complex in general vulnerable, especially at such extremes.
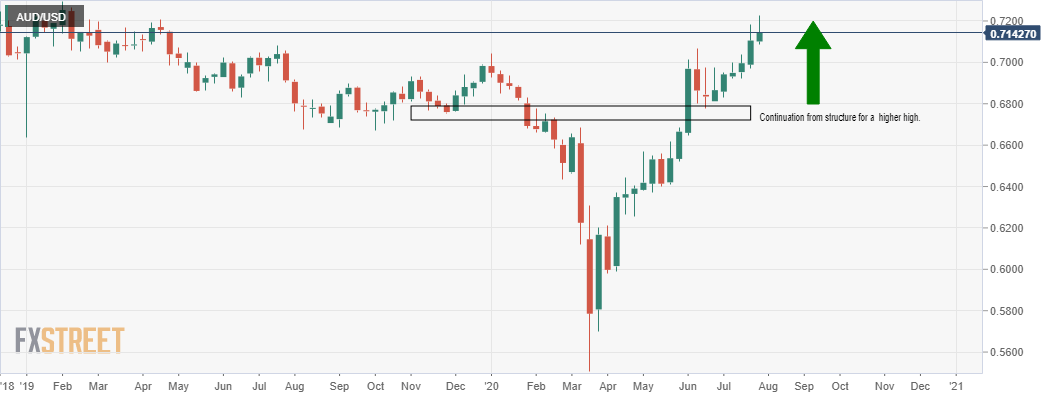
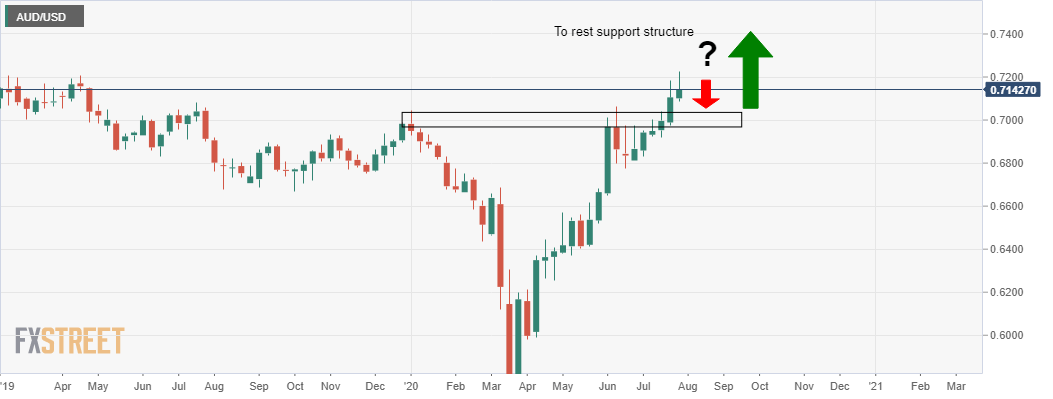
Ahead of this week's Reserve Bank of Australia, it is therefore apt that the Aussie looks so toppy on the charts with prospects of 'head and shoulders' formation in the making.
It will also not help the bull's case that at the start of the week, the Australian treasurer Frydenberg has said that the economic impact from Victoria lockdown will be greater.
Weekly chart
Daily chart
Daily H&S in the making?
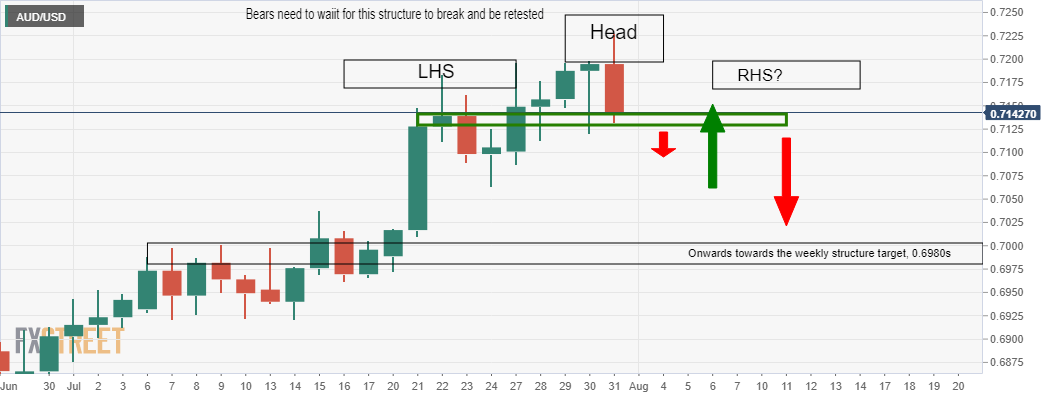
The above scenario and possible price action would obviously all be invalidated with a continuation of the sell-off in the greenback and subsequent long risk-on markets.
The 55-month moving average is located at 0.7284 should the support structure stand the test of time over the course of this week's pretty full economic calendar from both sides of the Pacific.
Author

Ross J Burland
FXStreet
Ross J Burland, born in England, UK, is a sportsman at heart. He played Rugby and Judo for his county, Kent and the South East of England Rugby team.

















