The chains that bind: Introducing the pressure gauge
Summary
When you are suffocating, any other problem in life fades away and all that matters is air. This is somewhat analogous to the globally integrated economy that is currently gasping for its version of air: the input components needed to do business and the means to get products to those who want to buy them. “When will these supply chain pressures begin to ease?” That is the question on everybody’s mind. You hear it from business owners, the Federal Reserve, fiscal policymakers, consumers, and financial market participants.
It is difficult to recall a time when business owners, policymakers, consumers, and financial markets have all been preoccupied with the same top-of-mind concern. We have yet to hear a compelling, data-based answer to this question, so we built our own tool to track it. In this first installment of a four-part series, we introduce our tool for thinking about the chains that bind, the Pressure Gauge. It suggests that bottlenecks are not yet easing in any widespread fashion, let alone close to being fully resolved. Subsequent reports in the coming days will look at the implications of supply chain struggles for inflation, the inventory cycle, and corporate profits.
Before COVID, goods, and products flowed through every corner of the planet, arriving seemingly by magic just when they were needed. Supply chains made it all possible, but it is increasingly evident that until the logjam clears, these disruptions are the chains that bind, holding back the economy from reaching its full potential.
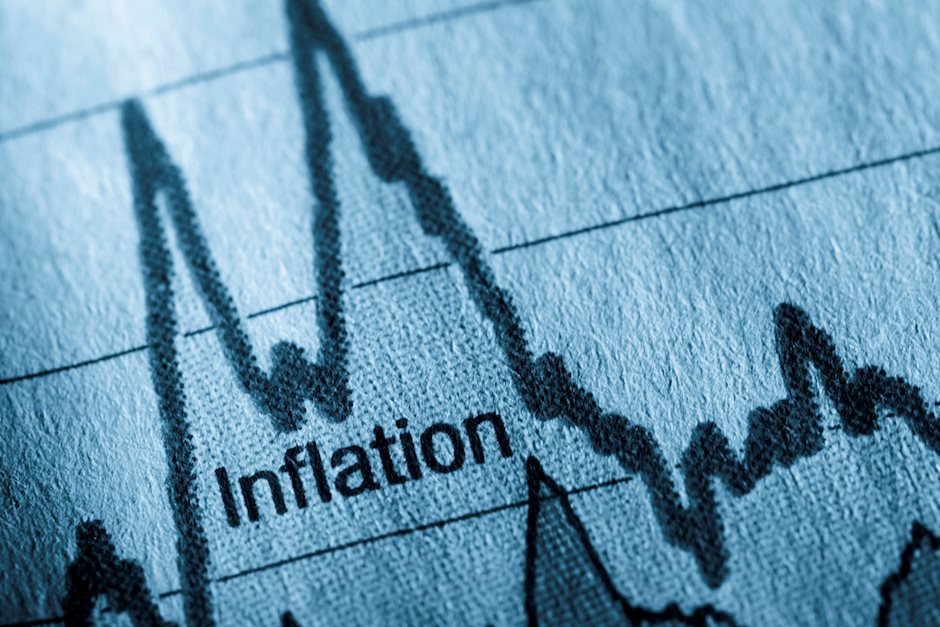
When will the supply chain pressure begin to ease?
An empirical question is one that can be answered by collecting data from experience and observation. A conceptual question is more philosophical and harder to answer with facts and figures alone. Perhaps one reason why it is tough to get a straight answer when it comes to supply chain pressure easing is that it is a question that plays somewhere between the empirical and the conceptual. Another reason may be that to truly understand the problem would require expertise in an impossibly broad collection of fields from inventory management to manufacturing to shipping and global trade.
We certainly do not claim that degree of expertise, but we realized that to measure current supply chain constraints, you need to source data from all of these fields. We have aggregated a variety of indicators to do that, dividing these components into five main categories: time, volume, price, inventory, and labor. Within most of these categories, we use both domestic and international indicators, although we lean more heavily toward domestic measures as our primary focus is the impact on the U.S. economy.
Just as the pandemic that preceded it, however, this question of when supply chain strains will ease knows no borders. Even when all of the input components can be sourced properly and matched with the labor and equipment to make a final product, delays and a global shortage of shipping space mean it is taking much longer for goods to get to market. “Normal” supply dynamics may be a ways off, but knowing when conditions are moving in that direction is a start in answering pressing questions about the economic outlook.
Author

Wells Fargo Research Team
Wells Fargo


