The Bulls Stampede

Good Morning Traders,
As of this writing 3:50 AM EST, here’s what we see:
US Dollar: Sept. USD is Up at 93.935.
Energies: Aug '18 Crude is Down at 73.67.
Financials: The Sept 30 year bond is Up 18 ticks and trading at 145.18.
Indices: The Sept S&P 500 emini ES contract is 93 ticks Lower and trading at 2773.50.
Gold: The Aug gold contract is trading Down at 1253.10. Gold is 23 ticks Lower than its close.
Initial Conclusion
This is not a correlated market. The dollar is Up+ and Crude is Down- which is normal and the 30 year Bond is trading Higher. The Financials should always correlate with the US dollar such that if the dollar is lower then bonds should follow and vice-versa. The S&P is Lower and Crude is trading Lower which is not correlated. Gold is trading Down- which is correlated with the US dollar trading Up+. I tend to believe that Gold has an inverse relationship with the US Dollar as when the US Dollar is down, Gold tends to rise in value and vice-versa. Think of it as a seesaw, when one is up the other should be down. I point this out to you to make you aware that when we don't have a correlated market, it means something is wrong. As traders you need to be aware of this and proceed with your eyes wide open.
At this hour all of Asia is trading Lower with the exception of the Indian Sensex which is trading Higher at this time. As of this writing all of Europe is trading Lower.
Possible Challenges To Traders Today
-
Core PPI is out at 8:30 AM EST. This is major.
-
PPI is out at 8:30 AM EST. This is major.
-
Final Wholesale Inventories is out at 10 AM EST.
-
Major. Crude Oil Inventories is out at 10:30 AM EST. This is major.
-
FOMC Member Bostic Speaks at 12:30 PM EST. Major.
-
10-y Bond Auction starts at 1 PM EST. This is major.
-
FOMC Member Williams Speaks at 4:30 PM EST. Major.
Treasuries
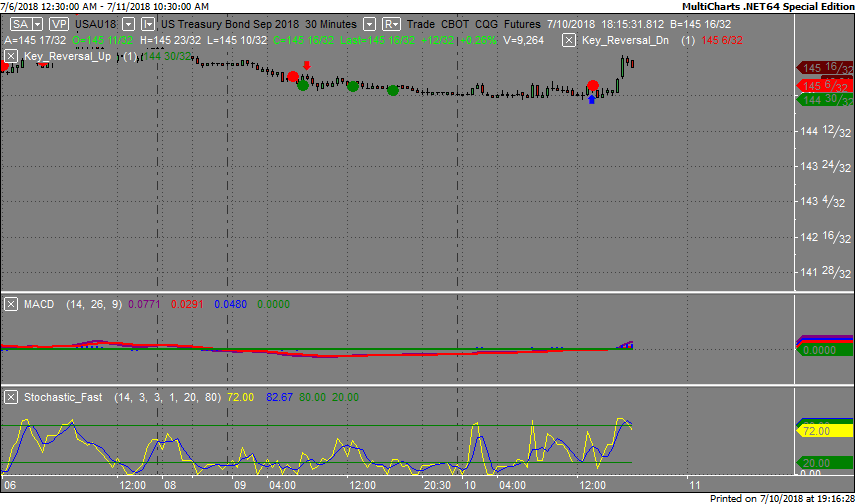
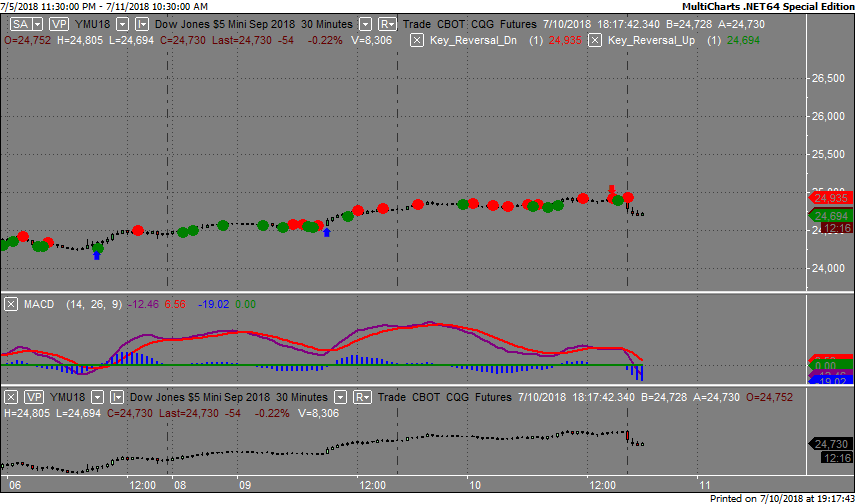
We've elected to switch gears a bit and show correlation between the 30 year bond (ZB) and The YM futures contract. The YM contract is the DJIA and the purpose is to show reverse correlation between the two instruments. Remember it's liken to a seesaw, when up goes up the other should go down and vice versa.
Yesterday the ZB made it's move at around 1:30 PM EST. The ZB hit a Low at around that time and the YM hit a High. If you look at the charts below ZB gave a signal at around 1:30 PM EST and the YM was moving Lower at the same time. Look at the charts below and you'll see a pattern for both assets. ZB hit a Low at around 1:30 PM and the YM was moving Lower at the same time. These charts represent the newest version of MultiCharts and I've changed the timeframe to a 30 minute chart to display better. This represented a long opportunity on the 30 year bond, as a trader you could have netted about 15 ticks per contract on this trade. Each tick is worth $31.25.
Charts Courtesy of MultiCharts built on an AMP platform
Bias
Yesterday we gave the markets a Neutral bias as the indices didn't seem to have any sense of direction Tuesday morning. The Dow rose 143 points and the other indices gained ground as well. Today we aren't dealing with a correlated market and our bias is to the Downside.
Could this change? Of Course. Remember anything can happen in a volatile market.
Commentary
Most traders by now are thinking "if this is a trade war, then bring it on" as the Dow rose for the fourth day in a row. This however is a short sighted vision as the proverbial tariffs haven't kicked in as yet but once they do, prices will rise and no one will like that result. Today we have 7 economic reports, most of which are major and proven market movers.
Author

Nick Mastrandrea
Market Tea Leaves


