The Bulls Roar…again

Good Morning Traders,
As of this writing 4:10 AM EST, here’s what we see:
US Dollar: Sept. USD is Up at 96.125.
Energies: Sept '18 Crude is Up at 65.24.
Financials: The Sept 30 year bond is Up 4 ticks and trading at 144.21.
Indices: The Sept S&P 500 emini ES contract is 28 ticks Higher and trading at 2859.25.
Gold: The Dec Gold contract is trading Up at 1195.20 Gold is 109 ticks Higher than its close.
Initial Conclusion
This is not a correlated market. The dollar is Up+ and Crude is Up+ which is not normal and the 30 year Bond is trading Higher. The Financials should always correlate with the US dollar such that if the dollar is lower then bonds should follow and vice-versa. The S&P is Higher and Crude is trading Higher which is not correlated. Gold is trading Up+ which is not correlated with the US dollar trading Higher. I tend to believe that Gold has an inverse relationship with the US Dollar as when the US Dollar is down, Gold tends to rise in value and vice-versa. Think of it as a seesaw, when one is up the other should be down. I point this out to you to make you aware that when we don't have a correlated market, it means something is wrong. As traders you need to be aware of this and proceed with your eyes wide open.
At this hour Asia is trading mainly Higher with the exception of the Nikkei and Singapore exchanges which are trading Lower at this time. Currently all of Europe is trading Higher.
Possible Challenges To Traders Today
-
FOMC Member Bostic Speaks at 11 AM EST. This is major.
-
Lack of major economic news.
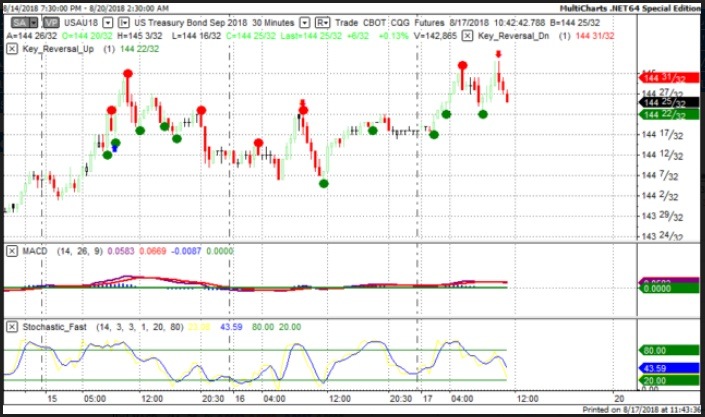
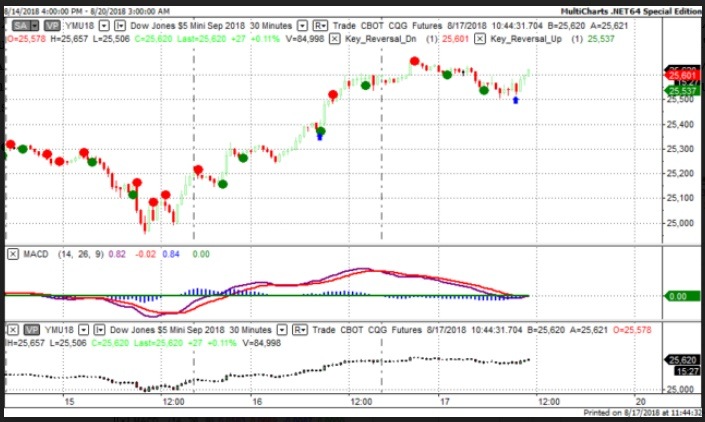
Treasuries
We've elected to switch gears a bit and show correlation between the 30 year bond (ZB) and The YM futures contract. The YM contract is the DJIA and the purpose is to show reverse correlation between the two instruments. Remember it's liken to a seesaw, when up goes up the other should go down and vice versa.
On Friday the ZB made it's move at around 10 AM EST. The ZB hit a High at around that time and the YM hit a Low. If you look at the charts below ZB gave a signal at around 10 AM EST and the YM was moving Higher at the same time. Look at the charts below and you'll see a pattern for both assets. ZB hit a High at around 10 AM and the YM was moving Higher at the same time. These charts represent the newest version of MultiCharts and I've changed the timeframe to a 30 minute chart to display better. This represented a shorting opportunity on the 30 year bond, as a trader you could have netted about 15 plus ticks per contract on this trade. Each tick is worth $31.25.
Charts Courtesy of MultiCharts built on an AMP platform.
Bias
On Friday we gave the markets a Neutral bias as the instruments we track didn't seem to have any sense of direction associated with it. The markets gravitated to the Upside on Friday with the Dow gaining 111 points and the other indices gained ground as well. Today we aren't dealing with a correlated market and will maintain a Neutral bias.
Could this change? Of Course. Remember anything can happen in a volatile market.
Commentary
So it looks as though the Turkish Tantrum has given way to the idea that the US government and China will resume trade talks in the near future. Even Elon Musk's ‘excruciating year’ couldn't dampen the market's spirit. Today we are light on economic news but have an FOMC member speaking at 11 AM EST.
On Thursday, April 5th we had the honor and privilege to be interviewed by David Lincoln on his You Tube channel. David is a floor trader for the options markets. If you listen to this interview, you will enjoy it.
Author

Nick Mastrandrea
Market Tea Leaves


