The bulls roar [Video]
![The bulls roar [Video]](https://editorial.fxstreet.com/images/TechnicalAnalysis/Positioning/wall-street-bull-gm531163035-55312452_XtraLarge.jpg)
US Dollar: Dec '21 USD is Up at 93.140.
Energies: Nov '21 Crude is Up at 73.42.
Financials: The Dec '21 30 Year bond is Down 7 ticks and trading at 163.30.
Indices: The Dec '21 S&P 500 emini ES contract is 56 ticks Lower and trading at 4424.00.
Gold: The Dec'21 Gold contract is trading Up at 1755.10. Gold is 53 ticks Higher than its close.
Initial conclusion
This is not a correlated market. The dollar is Up and Crude is Up which is not normal and the 30 year Bond is trading Lower. The Financials should always correlate with the US dollar such that if the dollar is lower then bonds should follow and vice-versa. The S&P is Lower and Crude is trading Higher which is correlated. Gold is trading Higher which is not correlated with the US dollar trading Up. I tend to believe that Gold has an inverse relationship with the US Dollar as when the US Dollar is down, Gold tends to rise in value and vice-versa. Think of it as a seesaw, when one is up the other should be down. I point this out to you to make you aware that when we don't have a correlated market, it means something is wrong. As traders you need to be aware of this and proceed with your eyes wide open. Currently Asia is trading Mixed with the exchanges Higher and the other half Lower. All of Europe is trading Lower at this time.
Possible challenges to traders today
-
Fed Chair Powell Speaks at 10 AM EST. This is Major.
-
New Home Sales is out at 10 AM EST. This is Major.
Treasuries
Traders please note that we've changed the Bond instrument from the 30 year (ZB) to the 10 year (ZN). They work exactly the same.
We've elected to switch gears a bit and show correlation between the 10 year bond (ZN) and The S&P futures contract. The S&P contract is the Standard and Poor's and the purpose is to show reverse correlation between the two instruments. Remember it's liken to a seesaw, when up goes up the other should go down and vice versa.
Yesterday the ZN made it's move at around 8 AM EST. The ZN hit a High at around that time and the S&P moved Higher. If you look at the charts below ZN gave a signal at around 8 AM EST and the S&P moved Higher at around the same time. Look at the charts below and you'll see a pattern for both assets. ZN hit a High at around 8 AM EST and the S&P was moving Higher shortly thereafter. These charts represent the newest version of MultiCharts and I've changed the timeframe to a 15 minute chart to display better. This represented a Shorting opportunity on the 10 year note, as a trader you could have netted about 30 plus ticks per contract on this trade. Each tick is worth $15.625. Please note: the front month for the ZN is now Dec '21. The S&P contract is now Dec '21 as well. I've changed the format to Renko bars such that it may be more apparent and visible.
Charts courtesy of MultiCharts built on an AMP platform
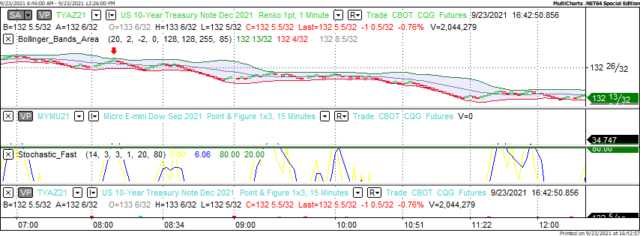
ZN - Dec 2021 - 9/23/21
-637680746923860353.png)
S&P - Dec 2021 - 9/23/21
Bias
Yesterday we gave the markets an Upside bias as the USD, Crude and the Bonds were all trading Lower Thursday morning and that is indicative of an Upside day. The markets didn't disappoint and the Dow rose 507 points and the other indices gained ground as well. Today we aren't dealing with a correlated market and our bias is to the Downside.
Could this change? Of Course. Remember anything can happen in a volatile market.
Commentary
Once again the markets gained ground on Thursday without a substantial way or mean of doing so. Unemployment Claims came in Higher than expected and that isn't positive and the other news reported wasn't stellar either. So this is a carry over from the FOMC Meeting on Wednesday. The only thing that makes sense is the Smart Money and the High New Worth individuals like the idea of a return on passive income which is what they will get when interest rates rise. Today we have New Home Sales and the Fed Chair Powell speaking, both of which are major and proven market movers.
Author

Nick Mastrandrea
Market Tea Leaves


