The Bulls Roar Back [Video]
![The Bulls Roar Back [Video]](https://editorial.fxstreet.com/images/TechnicalAnalysis/Positioning/bull-market-gm173588828-8161301_XtraLarge.jpg)
US Dollar: June USD is Up at 97.700.
Energies: June '19 Crude is Up at 63.24.
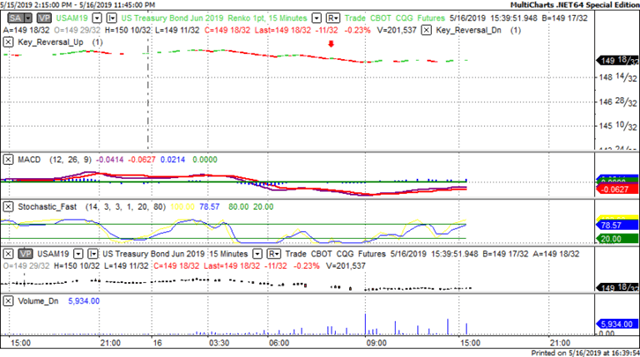
Financials: The Jun 30 year bond is Up 12 ticks and trading at 149.26.
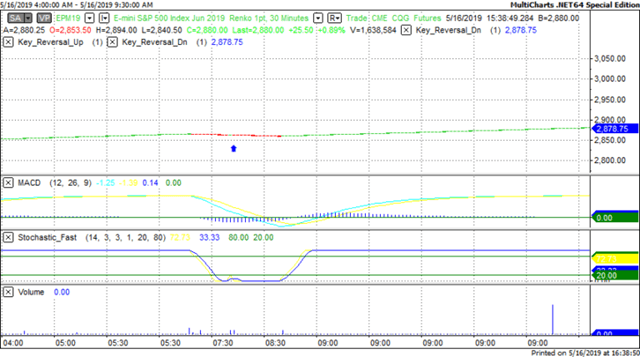
Indices: The June S&P 500 emini ES contract is 56 ticks Lower and trading at 2864.50.
Gold: The June Gold contract is trading Up at 1286.90. Gold is 6 ticks Higher than its close.
Initial Conclusion
This is not a correlated market. The dollar is Up+ and Crude is Up+ which is not normal and the 30 year Bond is trading Higher. The Financials should always correlate with the US dollar such that if the dollar is lower then bonds should follow and vice-versa. The S&P is Lower and Crude is trading Higher which is correlated. Gold is trading Higher which is not correlated with the US dollar trading Up. I tend to believe that Gold has an inverse relationship with the US Dollar as when the US Dollar is down, Gold tends to rise in value and vice-versa. Think of it as a seesaw, when one is up the other should be down. I point this out to you to make you aware that when we don't have a correlated market, it means something is wrong. As traders you need to be aware of this and proceed with your eyes wide open.
Asia is trading Mixed with half the exchanges trading Higher and the other half Lower. Currently all of Europe is trading to the Downside.
Possible Challenges To Traders Today
-
Prelim UoM Consumer Sentiment is out at 10 AM EST. This is major.
-
Prelim UoM Inflation Expectations is out at 10 AM EST. This is major.
-
CB Leading Index m/m is out at 8:30 AM EST. This is major.
-
Prelim UoM Inflation Expectations is out at 10 AM EST. This is major.
-
FOMC Member Clarida Speaks at 1:40 PM. This is major.
Treasuries
We've elected to switch gears a bit and show correlation between the 30 year bond (ZB) and The YM futures contract. The YM contract is the DJIA and the purpose is to show reverse correlation between the two instruments. Remember it's liken to a seesaw, when up goes up the other should go down and vice versa.
Yesterday the ZB made a major move at around 8:30 AM EST. The ZB hit a High at around that time and the YM hit a Low. If you look at the charts below ZB gave a signal at around 8:30 AM EST and the YM was moving Higher at the same time. Look at the charts below and you'll see a pattern for both assets. ZB hit a High at around 9 AM and the YM was moving Higher at the same time. These charts represent the newest version of MultiCharts and I've changed the timeframe to a 15 minute chart to display better. This represented a Shorting opportunity on the 30 year bond, as a trader you could have netted about 12 ticks per contract on this trade. Each tick is worth $31.25. Please note: the front month for the ZB contract is now June, 2019 and I've changed the format to Renko bars such that it may be more apparent and visible.
Charts Courtesy of MultiCharts built on an AMP platform.
Bias
Yesterday we gave the markets an Upside bias and the markets didn't disappoint. The Dow gained 215 points and the other indices gained ground as well. Today we aren't dealing with a correlated market and our bias is to the downside.
Could this change? Of Course. Remember anything can happen in a volatile market.
Commentary
It appeared as though the rules of Market Correlation will win out regardless of geopolitical events, trade wars, scandals and bad press. Yesterday we predicted an Upside day and the markets didn't disappoint as the Dow gained 215 points for the day. Today our bias is to the downside. What could change this? A solid trade agreement between the US and China however the Chinese appear to be perfectly fine with an increase in tariffs. Why? Because the Chinese aren't paying those tariffs. The American consumer will pay for them in the form of higher prices for the same goods and services. Too bad the folks in DC haven't figured this out yet.
Author

Nick Mastrandrea
Market Tea Leaves


