US Dollar: Sept USD is Up at 97.450.

Energies: Sept '19 Crude is Up at 52.80.

Financials: The Sept 30 year bond is Up 6 ticks and trading at 161.24.

Indices: The Sept S&P 500 emini ES contract is 64 ticks Lower and trading at 2924.00.

Gold: The Dec Gold contract is trading Up at 1514.00  Gold is 45 ticks Higher than its close.

Initial Conclusion

This is not a correlated market.  The dollar is Up+ and Crude is Up+ which is not normal and the 30 year Bond is trading Higher.  The Financials should always correlate with the US dollar such that if the dollar is lower then bonds should follow and vice-versa. The S&P is Higher and Crude is trading Higher which is not correlated. Gold is trading Higher which is not correlated with the US dollar trading Up.   I tend to believe that Gold has an inverse relationship with the US Dollar as when the US Dollar is down, Gold tends to rise in value and vice-versa. Think of it as a seesaw, when one is up the other should be down. I point this out to you to make you aware that when we don't have a correlated market, it means something is wrong. As traders you need to be aware of this and proceed with your eyes wide open.

Currently Asia is trading Mixed with half the exchanges trading Higher and the other half Lower.  At this time all of  Europe is trading to the Downside.  

Possible Challenges To Traders Today

  • Core PPI is out at 8:30 AM EST.  This is major.

  • PPI is out at 8:30 AM EST.  This is major.

 Treasuries

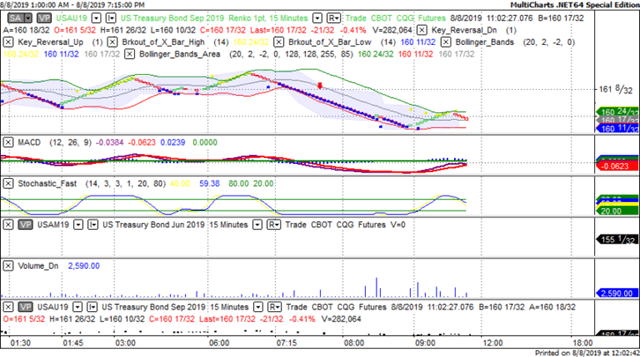
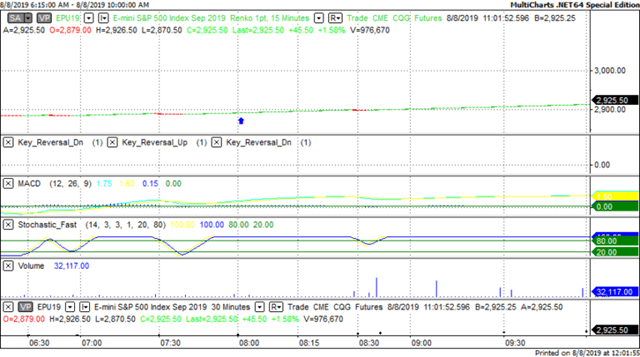
We've elected to switch gears a bit and show correlation between the 30 year bond (ZB) and The YM futures contract.  The YM contract is the DJIA and the purpose is to show reverse correlation between the two instruments.  Remember it's liken to a seesaw, when up goes up the other should go down and vice versa.

Yesterday the ZB made a major move at around 8 AM EST.  The ZB hit a High at around that time and the YM hit a Low.  If you look at the charts below ZB gave a signal at around 8 AM EST and the YM was moving Higher at the same time. Look at the charts below and you'll see a pattern for both assets. ZB hit a High at around 8 AM and the YM was moving Higher at the same time.  These charts represent the newest version of MultiCharts and I've changed the timeframe to a 15 minute chart to display better.  This represented a Shorting opportunity on the 30 year bond, as a trader you could have netted about 20 plus ticks per contract on this trade.  Each tick is worth $31.25.  Please note: the front month for both the ZB and YM contract is now September, 2019 and I've changed the format to Renko bars such that it may be more apparent and visible.

Charts Courtesy of MultiCharts built on an AMP platform

fxsoriginal

fxsoriginal

Bias

Yesterday we gave the markets an Upside bias as the USD, Bonds and Gold were all trading Lower yesterday morning and this did bode well for an Upside day.  The markets didn't disappoint as the Dow gained 371 points and the other indices gained ground as well.  Today we aren't dealing with a correlated market and our bias is to the Downside.

Could this change? Of Course.  Remember anything can happen in a volatile market. 

Commentary

Yesterday morning the markets showed resilience as everything was pointed to an Upside day as the USD, Gold and the Bonds were all trading Higher Thursday morning and this usually bodes well for an Upside day.  The markets didn't disappoint as all indices closed Higher yesterday.  Today we have PPI numbers out at 8:30 AM EST.  I wouldn't underestimate these numbers as the Fed does use them to determine rate cuts going forward.

Trading performance displayed herein is hypothetical. The following Commodity Futures Trading Commission (CFTC) disclaimer should be noted.

Hypothetical performance results have many inherent limitations, some of which are described below. No representation is being made that any account will or is likely to achieve profits or losses similar to those shown.

In fact, there are frequently sharp differences between hypothetical performance results and the actual results subsequently achieved by any particular trading program. One of the limitations of hypothetical performance trading results is that they are generally prepared with the benefit of hindsight.

In addition, hypothetical trading does not involve financial risk, and no hypothetical trading record can completely account for the impact of financial risk in actual trading. For example, the ability to withstand losses or to adhere to a particular trading program in spite of trading losses are material points which can also adversely affect actual trading results.

There are numerous other factors related to the markets in general or to the implementation of any specific trading program which cannot be fully accounted for in the preparation of hypothetical performance results and all of which can adversely affect actual trading results.

Trading in the commodities markets involves substantial risk and YOU CAN LOSE A LOT OF MONEY, and thus is not appropriate for everyone. You should carefully consider your financial condition before trading in these markets, and only risk capital should be used.

In addition, these markets are often liquid, making it difficult to execute orders at desired prices. Also, during periods of extreme volatility, trading in these markets may be halted due to so-called “circuit breakers” put in place by the CME to alleviate such volatility. In the event of a trading halt, it may be difficult or impossible to exit a losing position.

Recommended Content


Recommended Content

Editors’ Picks

AUD/USD rises to two-day high ahead of Aussie CPI

AUD/USD rises to two-day high ahead of Aussie CPI

The Aussie Dollar recorded back-to-back positive days against the US Dollar and climbed more than 0.59% on Tuesday, as the US April S&P PMIs were weaker than expected. That spurred speculations that the Federal Reserve could put rate cuts back on the table. The AUD/USD trades at 0.6488 as Wednesday’s Asian session begins.

AUD/USD News

EUR/USD holds above 1.0700 on weaker US Dollar, upbeat Eurozone PMI

EUR/USD holds above 1.0700 on weaker US Dollar, upbeat Eurozone PMI

EUR/USD holds above the 1.0700 psychological barrier during the early Asian session on Wednesday. The weaker-than-expected US PMI data for April drags the Greenback lower and creates a tailwind for the pair. 

EUR/USD News

Gold price cautious despite weaker US Dollar and falling US yields

Gold price cautious despite weaker US Dollar and falling US yields

Gold retreats modestly after failing to sustain gains despite fall in US Treasury yields, weaker US Dollar. XAU/USD struggles to capitalize following release of weaker-than-expected S&P Global PMIs, fueling speculation about potential Fed rate cuts.

Gold News

Ethereum ETF issuers not giving up fight, expert says as Grayscale files S3 prospectus

Ethereum ETF issuers not giving up fight, expert says as Grayscale files S3 prospectus

Ethereum exchange-traded funds theme gained steam after the landmark approval of multiple BTC ETFs in January. However, the campaign for approval of this investment alternative continues, with evidence of ongoing back and forth between prospective issuers and the US SEC.

Read more

US versus the Eurozone: Inflation divergence causes monetary desynchronization

US versus the Eurozone: Inflation divergence causes monetary desynchronization

Historically there is a very close correlation between changes in US Treasury yields and German Bund yields. This is relevant at the current juncture, considering that the recent hawkish twist in the tone of the Fed might continue to push US long-term interest rates higher and put upward pressure on bond yields in the Eurozone.

Read more

Majors

Cryptocurrencies

Signatures