The Bulls Roar

Good Morning Traders,
As of this writing 3:50 AM EST, here’s what we see:
US Dollar: Jun. USD is Up at 89.345.
Energies: May '18 Crude is Up at 67.04.
Financials: The June 30 year bond is Down 13 ticks and trading at 145.20.
Indices: The June S&P 500 emini ES contract is 22 ticks Higher and trading at 2712.00.
Gold: The June gold contract is trading Down at 1347.20. Gold is 23 ticks Lower than its close.
Initial Conclusion
This is not a correlated market. The dollar is Up+ and Crude is Up+ which is not normal and the 30 year Bond is trading Lower. The Financials should always correlate with the US dollar such that if the dollar is lower then bonds should follow and vice-versa. The S&P is Higher+ and Crude is trading Higher+ which is not correlated. Gold is trading Down- which is correlated with the US dollar trading Up+. I tend to believe that Gold has an inverse relationship with the US Dollar as when the US Dollar is down, Gold tends to rise in value and vice-versa. Think of it as a seesaw, when one is up the other should be down. I point this out to you to make you aware that when we don't have a correlated market, it means something is wrong. As traders you need to be aware of this and proceed with your eyes wide open.
At this hour all of Asia is trading Higher. All of Europe is trading Higher at this time as well.
Possible Challenges To Traders Today
-
Crude Oil Inventories are out at 10:30 AM EST. This is major.
-
Beige Book is out at 2 PM EST. This is major.
-
FOMC Member Dudley Speaks at 3:15 PM EST. This is major.
-
FOMC Member Quarles Speaks at 4:15 PM EST. This is major.
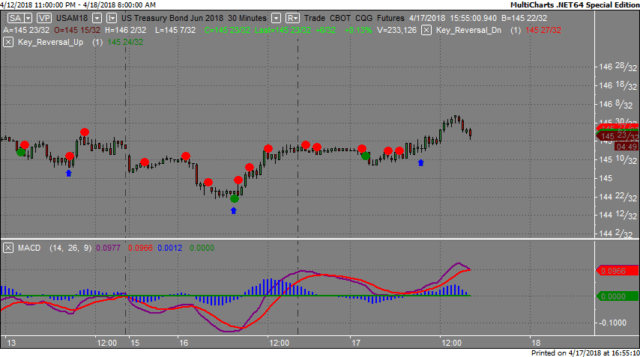
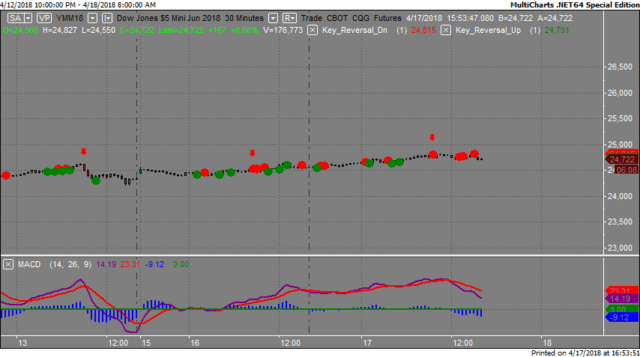
Treasuries
We've elected to switch gears a bit and show correlation between the 30 year bond (ZB) and The YM futures contract. The YM contract is the DJIA and the purpose is to show reverse correlation between the two instruments. Remember it's liken to a seesaw, when up goes up the other should go down and vice versa.
Yesterday the ZB made it's move at around 9:30 AM EST. The ZB hit a Low at around that time and the YM hit a High. If you look at the charts below ZB gave a signal at around 9:30 AM EST and the YM was moving Higher at the same time. Look at the charts below and you'll see a pattern for both assets. ZB hit a Low at around 9:30 AM and the YM hit a High. These charts represent the newest version of MultiCharts and I've changed the timeframe to a 30 minute chart to display better. This represented a long opportunity on the 30 year bond, as a trader you could have netted about 30 plus ticks per contract on this trade. Each tick is worth $31.25.
Charts Courtesy of MultiCharts built on an AMP platform
Bias
Yesterday we gave the markets an Upside bias as the USD, Bonds and Gold were all trading Lower yesterday morning and this usually reflects the basis of an Upside day. The markets didn't disappoint as the Dow rose 214 points and the other indices gained ground as well. Today we aren't dealing with a correlated market however our bias is to the Upside.
Could this change? Of Course. Remember anything can happen in a volatile market.
Commentary
Nothing earth shattering occurred yesterday as the markets continued its upside trend. Positive economic news relative to Building Permits and Housing Starts helped fuel the upward movement as well as good earnings from Netflix and others assisted. Today we have Crude Oil Inventories as well as the Beige Book out at 2 PM EST. Time will tell how this serves the markets...
Author

Nick Mastrandrea
Market Tea Leaves


