The budget deficit big lie and when will soaring debt finally matter

Debt is over $31 trillion and rising by over a $1 trillion per year as far as the eye can see.
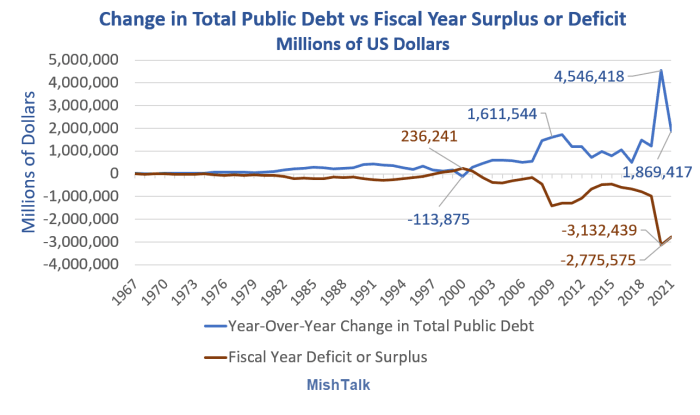
Change in public debt vs the purported fiscal year deficit. Data from St Louis Fed, chart by Mish.
Chart notes
-
The change is debt is end of calendar year from the end of the previous calendar year.
-
Alleged deficits are fiscal year distortions of reality.
The big deficit lie
Nearly every year, debt rises more than the alleged deficit. This is not a fiscal vs. calendar year distortion, but an ongoing deficit lie.
For example, there were alleged budget surpluses in four consecutive years, 1998 through 2001. Yet debt only fell once, in the year 2000, by 113.875 billion vs a purported budget surplus of $236.241 billion.
2001 had a reported surplus of $128,236 billion. Yet ,debt rose by $281,223 billion.
Spotlight 2020 and 2021
For 2020, the reported deficit was $3.132 trillion but debt rose by $4.546 trillion. That's a whopping negative discrepancy to the tune of $1.414 trillion.
For comparison purposes, in 2021 debt did not rise as much as the deficit. The deficit was $2.776 trillion but debt only rose by $1.869 trillion.
Those are Covid-related fiscal vs calendar year anomalies. Regardless, debt is high and rising, generally mush faster on average than reported deficits.
Debt vs Deficit Q&A
Q: Why does public debt generally rise more than the alleged deficit?
A: Mainly because deficits are a lie.
Here's the long answer.
Because the projected deficit does not include all of the amount owed to the Social Security Trust Fund. That amount is called off-budget. But when the calendar year rolls over, the difference magically appears on the balance sheet as actual debt.
Deficit scam
Excluding Social Security from the the fiscal year deficit is a purposeful accounting scam to make deficits appear smaller than they are.
Debt through calendar year 2021
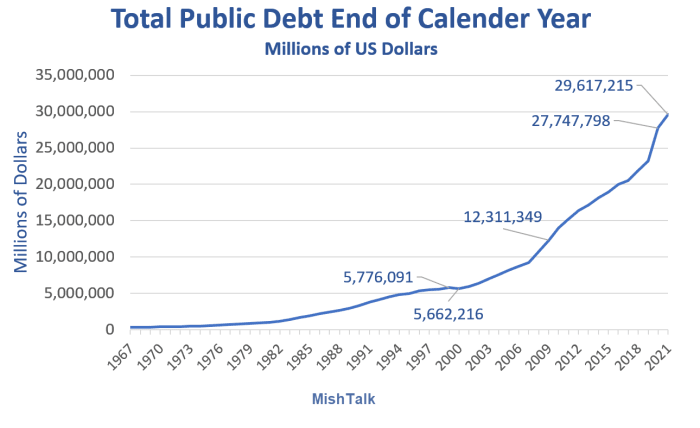
Public debt data from St Louis Fed, chart by Mish.
Only once, did debt shrink. That was in 2000. Those numbers are through 2021.
US debt clock to the second
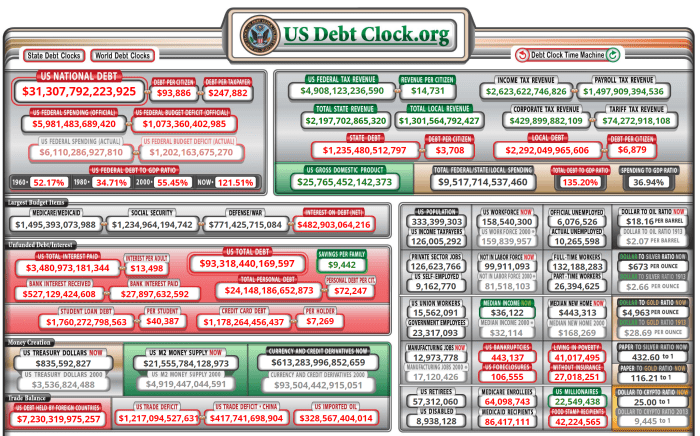
The DebtClock graph updates every second. If you have not yet visited the site please take a look.
2022 math
-
The 2021 year end debt was $29.621 trillion.
-
The alleged fiscal year 2022 deficit is $1,375 trillion.
-
2022 is not over but debt has already risen by $1.687 trillion.
Looking ahead, expect worse
The ongoing story is even worse. Congressional projected deficit assume no recession ever, and never do.
We are adding trillions in debt every year and it will get much worse. Interest on debt will soon hit $1 trillion a year.
A proposed fix

No, we do not have better trade deals, and no, tariffs did not reduce public debt. Nearly 50,000 economic illiterates like that Tweet.
Since Trump's 2018 Tweet, public debt rose by over $10 trillion.
When does this matter?
I don't know. You tell me. Just don't pretend it will never matter because it will.
Author

Mike “Mish” Shedlock's
Sitka Pacific Capital Management,Llc


