The BLS has been cooking jobs the numbers for a long time

President Donald Trump made headlines when he fired Bureau of Labor Statistics Commissioner Erika McEntarfer after a particularly bad July jobs report, calling it rigged.
I’ve been saying the numbers are rigged for a long time. In fact, significant downward revisions to the initial numbers have been the norm for years.
The july numbers
According to the July BLS report, the U.S. economy added just 73,000 jobs in July, significantly lower than the 110,000 forecast. That pushed the unemployment rate up a notch to 4.2 percent.
That was bad enough, but the downward revisions to the data for the previous two months were particularly eye-popping.
The number of jobs “created” in May was revised down from 144,000 to 19,000. In June, the number of new jobs dropped from 147,000 to 14,000.
In total, the BLS erased 258,000 jobs with a few computer strokes.
Trump’s reaction
President Trump said the numbers were “RIGGED” to "make the Republicans, and ME, look bad,” and fired McEntarfer, a Biden appointee. He said he wanted to put “people that we can trust” in these positions.
National Economic Council Director Kevin Hassett defended Trump, saying the revisions are “hard evidence, adding that there “have been a bunch of patterns that could make people wonder.”
"Why should anybody trust numbers?" the president quipped to reporters as he left the White House on Friday.
A history of revisions
I don’t know whether McEntarfer cooked the books to make Trump look bad or not, but there is plenty of evidence that the books are cooked, and that they have been for a long time.
The BLS has a long history of reporting rosy job numbers only to quietly come back and revise them downward down the road.
In 2023, job numbers were revised down in 10 of the 12 months.
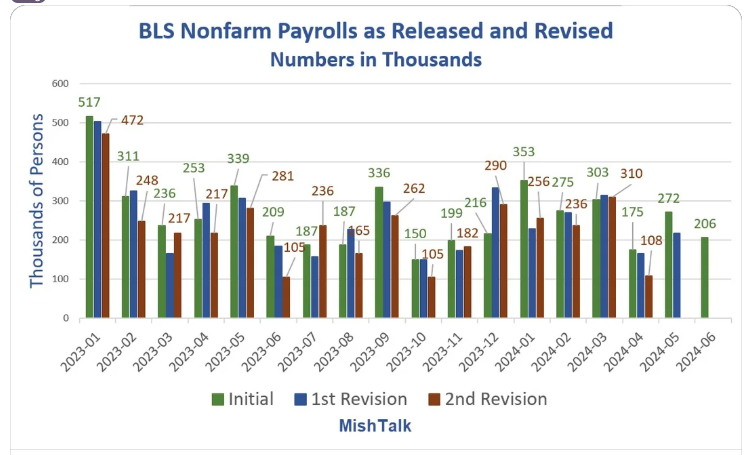
Looking back over time, it’s clear that revisions have always been part of the process. The thing that strikes me is that the revisions are almost always down. Since 2003, the final BLS numbers were lower than the initial report 14 times compared to seven upward revisions.
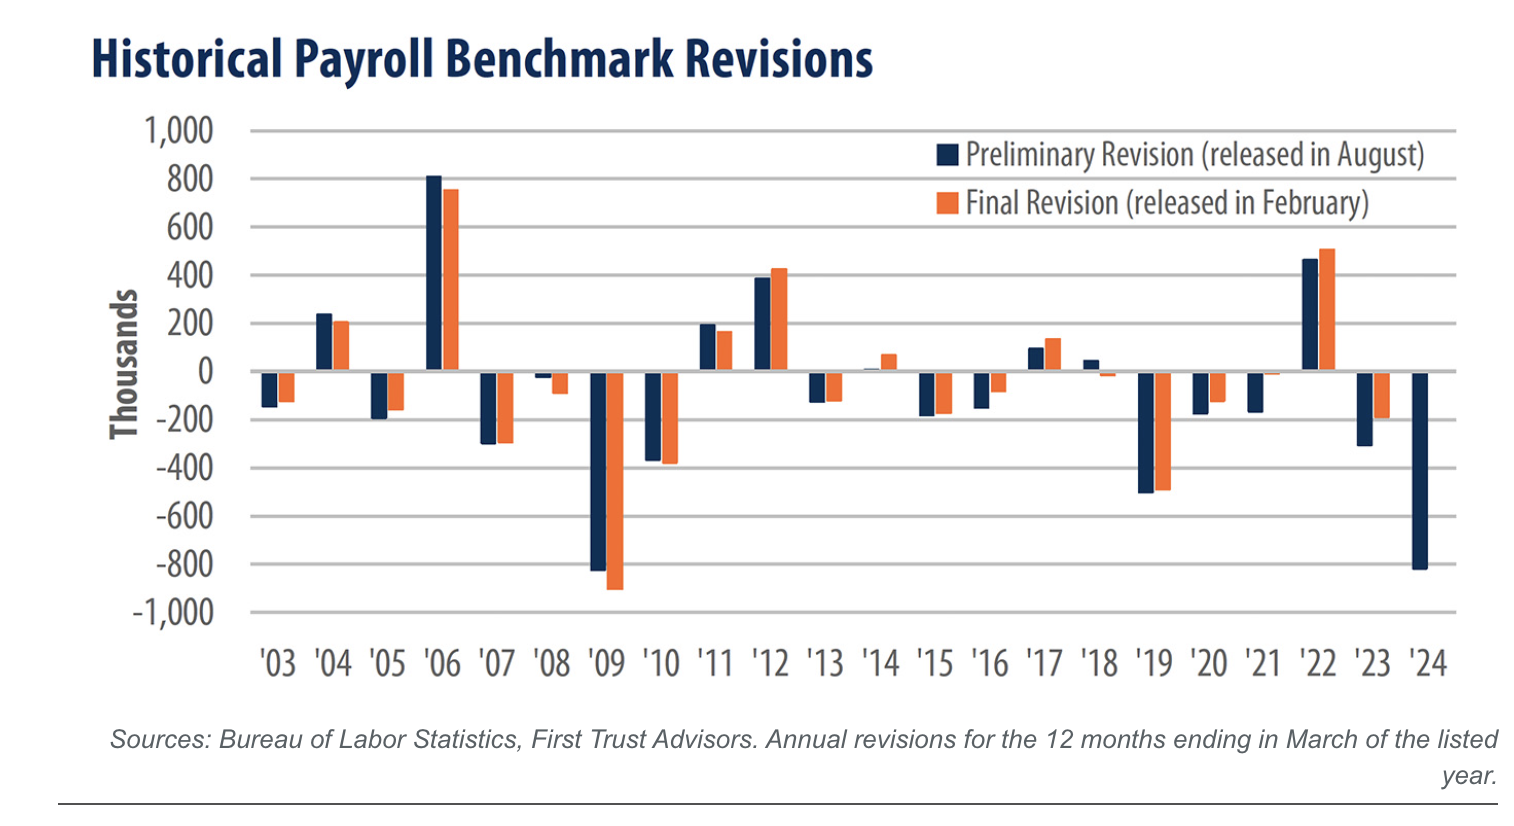
It’s almost as if the agency is trying to make the government look good.
When you look at the history, one has to wonder why anybody ever took these numbers at face value.
One could argue that calculating job data is a difficult process, and revisions are to be expected. I accept that argument, but when the error almost always occurs in the government’s favor, one has to wonder…
If the BLS were making honest mistakes month after month, you would think that sometimes they would underestimate the number of jobs created. But they almost always overestimate the numbers. If you flipped a coin and it came up heads 10 out of 12 times, you’d start to wonder about the integrity of that coin, wouldn’t you?
By the way, the job numbers aren’t only sketchy data pumped out of government agencies. I’ve argued for years that the CPI data grossly understates price inflation. And we know this is on purpose because the government literally changed to formula in the 1990s to understate the actual rise in prices. Based on the formula used in the 1970s, CPI is closer to double the official numbers. So, if the BLS used the old formula, we’d be looking at CPI closer to 6 percent. And using a truly honest formula, it would probably be worse than that.
The problem with the disingenuous BLS jobs data is that very few people pay attention to the revisions. (This month being the exception because they were just too big to ignore.)
The markets only react to the initial numbers. You never see markets rally because the BLS erased a bunch of jobs from the economy with a few clicks of its calculator. The revisions happen quietly in the back alleys. Nobody pays any attention to them. That creates the illusion that the labor market is much stronger than it actually is.
So, why should we trust any of these numbers, much less make decisions based on them?
Again, it’s important to wrap your head around the pattern here.
This month, the government reports good news. Everybody celebrates. Markets move. The following month, the government quietly revises everything downward and reports that the good news was really bad news.
And nobody pays attention.
It might be a good idea to pay attention – to the revisions too. And this is true no matter who is running the BLS.
The fact of the matter is, the economy isn’t nearly as rosy as the headlines would indicate.
To receive free commentary and analysis on the gold and silver markets, click here to be added to the Money Metals news service.
To receive free commentary and analysis on the gold and silver markets, click here to be added to the Money Metals news service.
Author

Mike Maharrey
Money Metals Exchange
Mike Maharrey is a journalist and market analyst for MoneyMetals.com with over a decade of experience in precious metals. He holds a BS in accounting from the University of Kentucky and a BA in journalism from the University of South Florida.
















