Good Morning Traders,

As of this writing 4 AM EST, here’s what we see:

US Dollar: Jun. USD is Up at 99.465.
Energies: May Crude is Down at 52.81.
Financials: The June 30 year bond is Down 10 ticks and trading at 154.27.
Indices: The June S&P 500 emini ES contract is 11 ticks Higher and trading at 2340.25.
Gold: The April gold contract is trading Down at 1286.90.  Gold is 72 ticks Lower than its close.

Initial Conclusion

This is not a correlated market. The dollar is Up+ and crude is Down-  which is normal but the 30 year bond is trading Lower. The Financials should always correlate with the US dollar such that if the dollar is lower then bonds should follow and vice-versa. The indices are Up+ and Crude is trading Down- which is correlated. Gold is trading Down- which is correlated with the US dollar trading Up+. I tend to believe that Gold has an inverse relationship with the US Dollar as when the US Dollar is down, Gold tends to rise in value and vice-versa. Think of it as a seesaw, when one is up the other should be down. I point this out to you to make you aware that when we don’t have a correlated market, it means something is wrong. As traders you need to be aware of this and proceed with your eyes wide open.

At this hour Asia is trading mainly Lower with the exception of the Nikkei exchange which are trading Higher. As of this writing Europe is trading Higher with the exception of the London and Paris exchanges.

Possible Challenges To Traders Today

–  Crude Oil Inventories are out at 10:30 AM EST.  This is major.

–  Beige Book is out at 2 PM EST.  This is major.

Treasuries

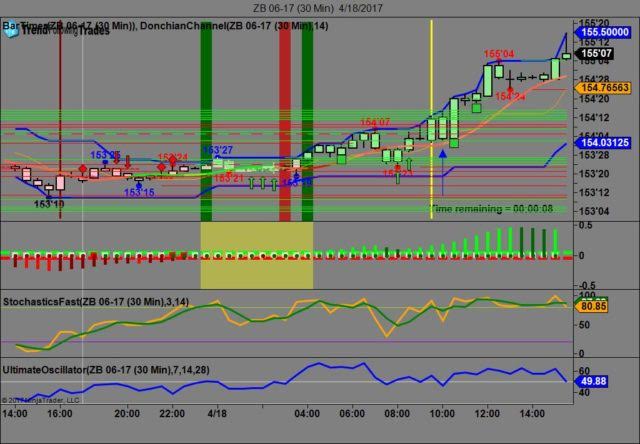
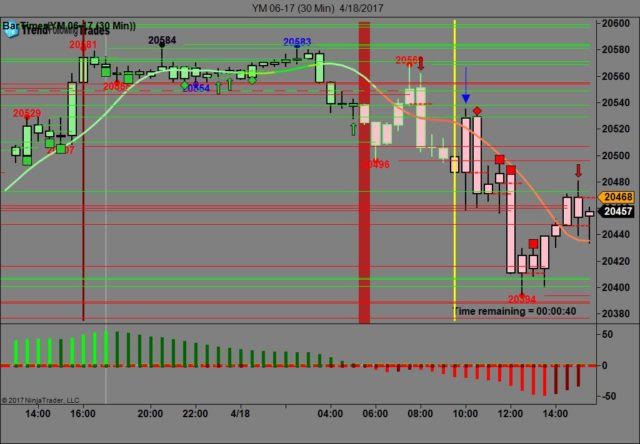
We’ve elected to switch gears a bit and show correlation between the 30 year bond (ZB) and The YM futures contract.  The YM contract is the DJIA and the purpose is to show reverse correlation between the two insbotruments.  Remember it’s liken to a seesaw, when up goes up the other should go down and vice versa.

Yesterday the ZB made it’s move at around 10 AM with no economic news in sight.  The ZB hit a low at around that time and the YM hit a high.  If you look at the charts below ZB gave a signal at around 10 AM and the YM was moving lower at the same time. Look at the charts below and you’ll see a pattern for both assets. ZB hit a low at around 10 AM and the YM hit a high.  These charts represent the newest version of Trend Following Trades and I’ve changed the timeframe to a 30 minute chart to display better.  This represented a long opportunity on the 30 year bond, as a trader you could have netted about 30 plus ticks per contract on this trade.  Each tick is worth $31.25.  We added a Donchian Channel to the charts to show the signals more clearly.

Charts Courtesy of Trend Following Trades built on a NinjaTrader platform.

Tea

Tea

Bias

Yesterday we gave the markets a neutral bias as we didn’t see a preponderance of evidence one way or the other hence the neutral bias.  The Dow dropped 114 points and the other indices lost ground as well.  Today we aren’t dealing with a correlated market however our bias is to the upside.

Could this change? Of Course.  Remember anything can happen in a volatile market. 

Commentary

Yesterday marked the first full day of trading after the Easter holiday and it seemed as though our thought regarding one day up and the next day down might be bearing some fruit as the Doe dropped 114 points yesterday and the other indices lost ground as well.  We gave the markets a neutral bias yesterday because even though the S&P was trading lower yesterday morning only one other instrument showed correlation with the S&P; that being the Bonds.  Today we are light on the eco news calendar as we only have Crude Oil Inventories out at 10:30 AM EST and the Beige Book out at 2 PM EST.

Trading performance displayed herein is hypothetical. The following Commodity Futures Trading Commission (CFTC) disclaimer should be noted.

Hypothetical performance results have many inherent limitations, some of which are described below. No representation is being made that any account will or is likely to achieve profits or losses similar to those shown.

In fact, there are frequently sharp differences between hypothetical performance results and the actual results subsequently achieved by any particular trading program. One of the limitations of hypothetical performance trading results is that they are generally prepared with the benefit of hindsight.

In addition, hypothetical trading does not involve financial risk, and no hypothetical trading record can completely account for the impact of financial risk in actual trading. For example, the ability to withstand losses or to adhere to a particular trading program in spite of trading losses are material points which can also adversely affect actual trading results.

There are numerous other factors related to the markets in general or to the implementation of any specific trading program which cannot be fully accounted for in the preparation of hypothetical performance results and all of which can adversely affect actual trading results.

Trading in the commodities markets involves substantial risk and YOU CAN LOSE A LOT OF MONEY, and thus is not appropriate for everyone. You should carefully consider your financial condition before trading in these markets, and only risk capital should be used.

In addition, these markets are often liquid, making it difficult to execute orders at desired prices. Also, during periods of extreme volatility, trading in these markets may be halted due to so-called “circuit breakers” put in place by the CME to alleviate such volatility. In the event of a trading halt, it may be difficult or impossible to exit a losing position.

Recommended Content


Recommended Content

Editors’ Picks

EUR/USD extends gains above 1.0700, focus on key US data

EUR/USD extends gains above 1.0700, focus on key US data

EUR/USD meets fresh demand and rises toward  1.0750 in the European session on Thursday. Renewed US Dollar weakness offsets the risk-off market environment, supporting the pair ahead of the key US GDP and PCE inflation data. 

EUR/USD News

USD/JPY keeps pushing higher, eyes 156.00 ahead of US GDP data

USD/JPY keeps pushing higher, eyes 156.00 ahead of US GDP data

USD/JPY keeps breaking into its highest chart territory since June of 1990 early Thursday, recapturing 155.50 for the first time in 34 years as the Japanese Yen remains vulnerable, despite looming intervention risks. The focus shifts to Thursday's US GDP report and the BoJ decision on Friday. 

USD/JPY News

Gold closes below key $2,318 support, US GDP holds the key

Gold closes below key $2,318 support, US GDP holds the key

Gold price is breathing a sigh of relief early Thursday after testing offers near $2,315 once again. Broad risk-aversion seems to be helping Gold find a floor, as traders refrain from placing any fresh directional bets on the bright metal ahead of the preliminary reading of the US first-quarter GDP due later on Thursday.

Gold News

Injective price weakness persists despite over 5.9 million INJ tokens burned

Injective price weakness persists despite over 5.9 million INJ tokens burned

Injective price is trading with a bearish bias, stuck in the lower section of the market range. The bearish outlook abounds despite the network's deflationary efforts to pump the price. 

Read more

US Q1 GDP Preview: Economic growth set to remain firm in, albeit easing from Q4

US Q1 GDP Preview: Economic growth set to remain firm in, albeit easing from Q4

The United States Gross Domestic Product (GDP) is seen expanding at an annualized rate of 2.5% in Q1. The current resilience of the US economy bolsters the case for a soft landing. 

Read more

Majors

Cryptocurrencies

Signatures