The Bears roar [Video]
![The Bears roar [Video]](https://editorial.fxstreet.com/images/TechnicalAnalysis/Positioning/bear-market-gm172776464-6578458_XtraLarge.jpg)
US Dollar: Dec '20 USD Down at 93.005.
Energies: Nov'20 Crude is Up at 38.84.
Financials: The Dec '20 30 year bond is Up 1 tick and trading at 173.20.
Indices: The Dec S&P 500 emini ES contract is 22 ticks Higher and trading at 3399.00
Gold: The Dec'20 Gold contract is trading Down at 1901.80 Gold is 38 ticks Lower than its close.
Initial Conclusion
This is not a correlated market. The dollar is Down- and Crude is Up+ which is normal but the 30 year Bond is trading Lower. The Financials should always correlate with the US dollar such that if the dollar is lower then bonds should follow and vice-versa. The S&P is Higher and Crude is trading Higher which is not correlated. Gold is trading Lower which is not correlated with the US dollar trading Down. I tend to believe that Gold has an inverse relationship with the US Dollar as when the US Dollar is down, Gold tends to rise in value and vice-versa. Think of it as a seesaw, when one is up the other should be down. I point this out to you to make you aware that when we don't have a correlated market, it means something is wrong. As traders you need to be aware of this and proceed with your eyes wide open.
Asia is trading mainly Lower with the exception of the Shanghai and Sensex exchanges. All of Europe is trading Lower at this time.
Possible Challenges To Traders Today
-
Core Durable Goods Orders is out at 8:30 AM EST. This is Major.
-
Durable Goods is out at 8:30 AM EST. This is Major.
-
HPI m/m is out at 9 AM EST. This is Major.
-
S&P/CS Composite-20 HPI y/y is out at 9 AM EST. This is Major.
-
CB Consumer Confidence is out at 10 AM EST. This is Major.
-
Richmond Manufacturing Index is out at 10 AM EST. Major.
Treasuries
Traders please note that we've changed the Bond instrument from the 30 year (ZB) to the 10 year (ZN). They work exactly the same.
We've elected to switch gears a bit and show correlation between the 10 year bond (ZN) and The S&P futures contract. The S&P contract is the Standard and Poor's and the purpose is to show reverse correlation between the two instruments. Remember it's liken to a seesaw, when up goes up the other should go down and vice versa.
Yesterday the ZN made it's move at around 8:30 AM EST. The ZN hit a Low at around that time and the S&P moved Lower. If you look at the charts below ZN gave a signal at around 8:30 AM EST and the S&P moved Lower at around the same time. Look at the charts below and you'll see a pattern for both assets. ZN hit a Low at around 8:30 AM EST and the S&P was moving Lower shortly thereafter. These charts represent the newest version of MultiCharts and I've changed the timeframe to a 15 minute chart to display better. This represented a Long opportunity on the 10 year note, as a trader you could have netted about a dozen ticks per contract on this trade. Each tick is worth $15.625. Please note: the front month for the ZN is now Dec '20. The S&P contract is also Dec '20 as well. I've changed the format to Renko bars such that it may be more apparent and visible.
Charts Courtesy of MultiCharts built on an AMP platform
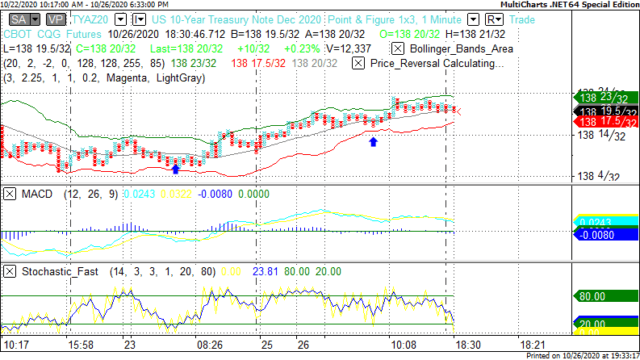
ZN - Dec 2020 - 10/26/20
-637393925576555769.png)
S&P - Dec 2020 - 10/26/20
Bias
Yesterday we gave the markets a Downside bias as both the USD and the Bonds were trading Higher yesterday morning and that usually reflects a Downside day. The markets didn't disappoint as the Dow fell 650 points and the other indices lost ground as well. Today we aren't dealing with a correlated market and our bias is Neutral.
Could this change? Of Course. Remember anything can happen in a volatile market.
Commentary
Yesterday we knew something was afoot as the indices was down by hundreds of points pre market and the global markets had all fallen as well. New Home Sales were down yesterday morning and some may attribute the markets fall on that. I don't think that's why. The think the markets have come to a conclusion that there won't be a stimulus package passed by Election Day and the Smart Money were all betting on the enactment of a stimulus package to inject new funds into the economy thereby avoiding economic slowdown. We haven't seen a drop-off of this magnitude in quite some time. Today we have more economic news than we had Monday. Can that change market direction? Only time will tell....
Author

Nick Mastrandrea
Market Tea Leaves


