The Bears Roar Back

US Dollar: Dec. USD is Down at 94.695.
Energies: Nov '18 Crude is Down at 71.25.
Financials: The Dec 30 year bond is Down 6 ticks and trading at 138.03.
Indices: The Dec S&P 500 emini ES contract is 45 ticks Higher and trading at 2760.00.
Gold: The Dec Gold contract is trading Up+ at 1233.20. Gold is 29 ticks Higher than its close.
Initial Conclusion
This is not a correlated market. The dollar is Down- and Crude is Down- which is not normal and the 30 year Bond is trading Lower. The Financials should always correlate with the US dollar such that if the dollar is lower then bonds should follow and vice-versa. The S&P is Lower and Crude is trading Lower which is not correlated. Gold is trading Up+ which is correlated with the US dollar trading Lower. I tend to believe that Gold has an inverse relationship with the US Dollar as when the US Dollar is down, Gold tends to rise in value and vice-versa. Think of it as a seesaw, when one is up the other should be down. I point this out to you to make you aware that when we don't have a correlated market, it means something is wrong. As traders you need to be aware of this and proceed with your eyes wide open.
At this hour all of Asia is trading Mixed with half the exchanges trading Higher and the other half Lower. Currently all of Europe is trading Higher with the exception of the London exchange which is down fractionally.
Possible Challenges To Traders Today
-
Capacity Utilization Rate is out at 9:15 AM EST. This is major.
-
Industrial Production is out at 9:15 AM EST. This is major.
-
JOLTS Job Openings is out at 10 AM. This is major.
-
NAHB Housing Market Index is out at 10 AM EST. This is major.
-
TIC Long-Term Purchases is out at 4 PM EST. This is Major.
-
Treasury Currency Report is out. This is Major.
Treasuries
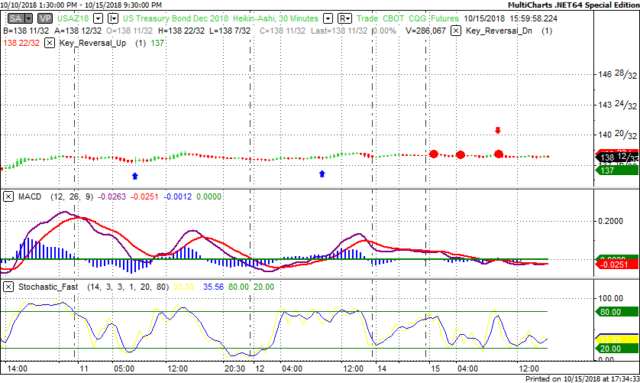
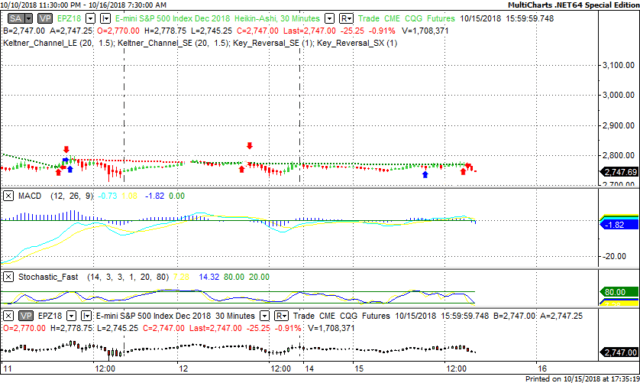
We've elected to switch gears a bit and show correlation between the 30 year bond (ZB) and The YM futures contract. The YM contract is the DJIA and the purpose is to show reverse correlation between the two instruments. Remember it's liken to a seesaw, when up goes up the other should go down and vice versa.
On Friday the ZB made it's move at around 9:30 AM EST. The ZB hit a High at around that time and the YM hit a Low. If you look at the charts below ZB gave a signal at around 9:30 AM EST and the YM was moving Higher at the same time. Look at the charts below and you'll see a pattern for both assets. ZB hit a High at around 9:30 AM and the YM was moving Higher at the same time. These charts represent the newest version of MultiCharts and I've changed the timeframe to a 30 minute chart to display better. This represented a shorting opportunity on the 30 year bond, as a trader you could have netted about a dozen ticks per contract on this trade. Each tick is worth $31.25.
Charts Courtesy of MultiCharts built on an AMP platform.
Bias
Yesterday we gave the markets a Downside bias and the markets didn't disappoint. The Dow dropped 89 points and the other indices lost ground as well. The USD, Gold and Crude were all trading Higher yesterday morning and that doesn't bode well for an Upside day, hence the Downside bias. Today we aren't dealing with a correlated market but our bias is to the Upside.
Could this change? Of Course. Remember anything can happen in a volatile market.
Commentary
Well it looks like the markets rising on Friday was short lived as the bears were definitely on the prowl yesterday. As predicted the markets did drop and all we did was to utilize our rules of market correlation. Each and every day the markets give us opportunities to profit either long or short so it helps to be on the right side of the market most of the time. Today we have Jolts Jobs Opening and the NAHB Housing Market Index, both of which are major and proven market movers.
Author

Nick Mastrandrea
Market Tea Leaves


