Tesla Rumor Torpedoes Markets

Good Morning Traders,
As of this writing 4:10 AM EST, here’s what we see:
US Dollar: Sept. USD is Up at 95.830.
Energies: Sept '18 Crude is Down at 66.26.
Financials: The Sept 30 year bond is Up 27 ticks and trading at 144.04.
Indices: The Sept S&P 500 emini ES contract is 55 ticks Lower and trading at 2840.00.
Gold: The Aug gold contract is trading Down at 1216.30 Gold is 35 ticks Lower than its close.
Initial Conclusion
This is a nearly correlated market and it's correlated to the Downside. The dollar is Up+ and Crude is Down- which is normal and the 30 year Bond is trading Higher. The Financials should always correlate with the US dollar such that if the dollar is lower then bonds should follow and vice-versa. The S&P is Lower and Crude is trading Higher which is correlated. Gold is trading Down- which is correlated with the US dollar trading Higher. I tend to believe that Gold has an inverse relationship with the US Dollar as when the US Dollar is down, Gold tends to rise in value and vice-versa. Think of it as a seesaw, when one is up the other should be down. I point this out to you to make you aware that when we don't have a correlated market, it means something is wrong. As traders you need to be aware of this and proceed with your eyes wide open.
At this hour all of Asia is trading Lower with the exception of the Shanghai exchange which is fractionally Higher at this time. Currently all of Europe is trading Lower.
Possible Challenges To Traders Today
-
Core CPI is out at 8:30 AM EST. This is major.
-
CPI is out at 8:30 AM EST. This is major.
-
Federal Budget Balance is out at 2 PM EST. This is major.
Treasuries
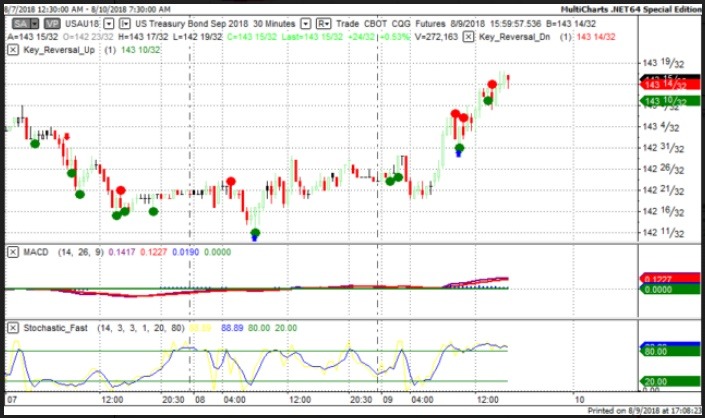
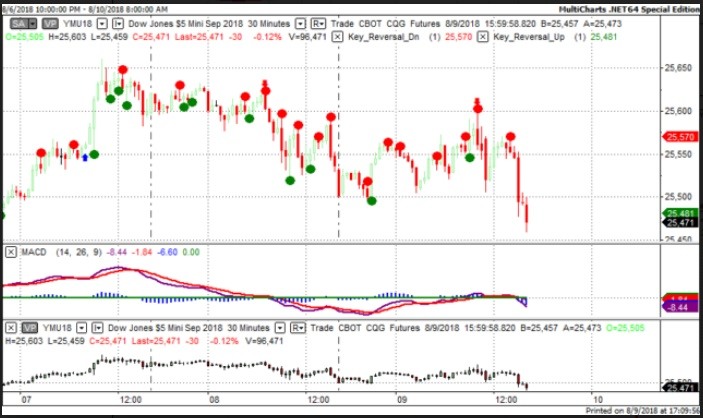
We've elected to switch gears a bit and show correlation between the 30 year bond (ZB) and The YM futures contract. The YM contract is the DJIA and the purpose is to show reverse correlation between the two instruments. Remember it's liken to a seesaw, when up goes up the other should go down and vice versa.
Yesterday the ZB made it's move at around 10 AM EST. The ZB hit a Low at around that time and the YM hit a High. If you look at the charts below ZB gave a signal at around 10 AM EST and the YM was moving Lower at the same time. Look at the charts below and you'll see a pattern for both assets. ZB hit a Low at around 10 AM and the YM was moving Lower at the same time. These charts represent the newest version of MultiCharts and I've changed the timeframe to a 30 minute chart to display better. This represented a Long opportunity on the 30 year bond, as a trader you could have netted about 17 ticks per contract on this trade. Each tick is worth $31.25.
Charts Courtesy of MultiCharts built on an AMP platform.
Bias
Yesterday we gave the markets a Downside bias as the indices didn't seem to have any sense of direction Thursday morning. The markets didn't disappoint as the Dow dropped 75 points, the S&P lost 4 and the Nasdaq gained 3. Today we're dealing with a nearly correlated market but it's correlated to the Downside.
Could this change? Of Course. Remember anything can happen in a volatile market.
Commentary
Yesterday we predicted a Downside market as the USD and the Bonds were both trading Higher and that is never a positive sign for an Upside day, hence the bias was to the Downside. The only thing that we can think of as to why the markets acted in that manner was a rumor started by none other than Elon Musk to take Tesla private. Fund Managers and the Smart Money don't like these types of rumors as it upsets their plans. There is however an old saying on the Street that goes something like "Buy the rumor, Sell the news." In other words perception becomes reality. Same analogy applies.
Author

Nick Mastrandrea
Market Tea Leaves


