Tesla Inc. vs. Goldman Sachs – We’re Backing Tesla!equiti

Tesla Inc – Expanding Diagonal!
Tesla Inc. caught our attention following last week’s publication of investment bank Goldman Sachs’ recent analyst report which stated suspicion over the sustainability of the Model 3 production rate for Q2 2018 and that it would probably be far lower than Tesla’s optimistic estimates.
CEO Elon Musk responded shortly after Goldman analysts advised clients to sell the stock by challenging them and any short-sellers by saying ‘place your bets’ to followers on twitter.
And from an Elliott Wave perspective, we agree with Elon Musk – this stock is trending higher again!
To understand how Tesla Inc. got to this point, we must travel back in time, to the origin of the dominant uptrend that originated from the Feb.’16 low of 141.05. February ’16 was a very important date, not just for Tesla, but for almost all global stock markets/indices, emerging-markets and commodities – why? – because this marked the end of counter-trend declines in each of these asset classes – it was the date when corrective declines for global stock markets completed from their 2015 highs and where emerging markets and commodities ended corrective declines that had begun from their 2011 highs.
They all converged at the same time, forming major, synchronous lows. We termed this the grand 'RE-SYNCHRONISATION' lows because up until that point, developed markets had been diverging with emerging markets and commodities for 5 years – now they were re-aligned!
Expanding Diagonal
Tesla Inc. has since traded higher from the Feb.16 low into a developing five wave impulse pattern, but it’s no ordinary impulse, it’s taking the form of a DIAGONAL-IMPULSE pattern. It still consists of five waves but a diagonal necessitates the ‘overlap’ of wave 4 into the price territory of wave 1 – see fig #1.
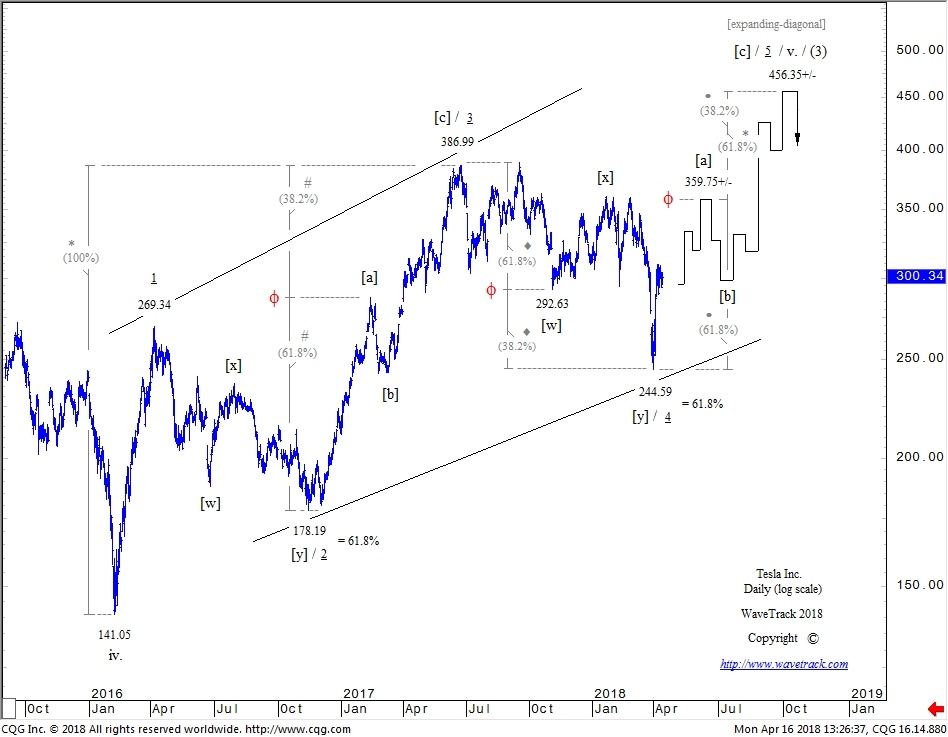
The diagonal is labelled in minute degree, 1-2-3-4-5 where its 1st wave ended an initial thrust higher to 269.34 in April ’16, the 3rd wave ended the next upswing into the June ’17 high at 386.99 but the 5th is still in upward progress.
Now there are many aspects of this diagonal which heightens its ‘integrity’ or validity. We already know the diagonal is an ‘expanding’ type rather than a contracting variation because of the time and depth of the correction of its 4th wave that ended recently in early-April at 244.59. The boundary lines that connect the 1st and 3rd waves, the 2nd and 4th are widening as time elapses. This means using slightly different Fibonacci-Price-Ratios (FPR’s) in measuring the finalising 5th wave advance.
Fibonacci-Price-Ratio Symmetry
In Tesla’s case, the 5th wave advance is shown unfolding by a fib. 61.8% ratio of the net advance of the 1st-3rd waves which projects a final high later this year towards 456.35+/-.
Note the other amazing fib-price-ratios in the diagonal’s development. This is an ‘ending’ type diagonal because it is the 5th wave within the intermediate-term uptrend that began way back in August ’11. Ending-diagonals usually contain impulse waves, i.e. 1st 3rd and 5th fifth’s that subdivide into [a]-[b]-[c] zig zags or doubles/triples. This is not easily visible in the 1st wave advance of this daily chart but it is clearly visible in the 3rd wave. Extending wave [a] to 287.39 by a fib. 61.8% ratio projects the terminal high for wave [c] of the 3rd at exactly the high traded in June ’17 at 386.99.
Furthermore, the 4th wave corrective decline that followed also measures amazingly into the early-April low at 244.59. This decline has unfolded into a double-three, labelled [w]-[x]-[y] and by extending the initial decline of [w] to 292.63 by a fib. 61.8% ratio projects the terminal low for [y] at 244.59!
The 5th wave has since begun to unfold higher and is expected to take the form of a three wave zig zag, labelled [a]-[b]-[c]. We’ve already measured the terminal high of the 5th to 456.35+/- earlier – if this is ‘cut’ by the ‘golden-ratio’ 61.8%, then an interim high is measured for wave [a] to 359.75+/-.
Conclusion
Stocks markets are still being jostled, pounded by conflicting news-flows but overall, we remain very optimistic for major indices over the next month. This positive outlook is also corroborated by Tesla Inc. too! Good luck Mr. Musk – we’re certainly endorsing your challenge!
Subscribe and get the latest forecasts on Stocks, FX & Commodities – NOW!
Author

Peter Goodburn
WaveTrack International GmbH
WTI HISTORY


