Technical & Trading Outlook EUR/USD

Last Update At 24 Jan 2017 00:31GMT
Trend Daily Chart
Sideways
Daily Indicators
Rising
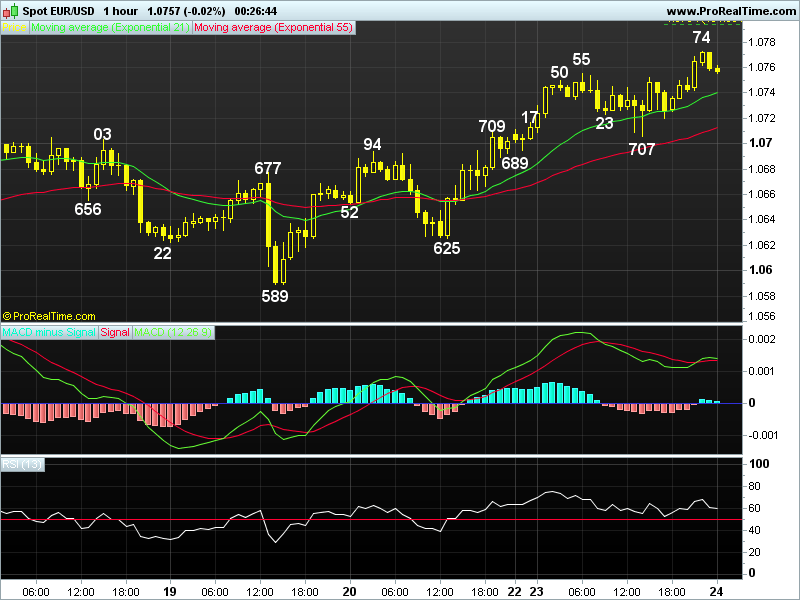
21 HR EMA
1.0740
55 HR EMA
1.0712
Trend Hourly Chart
Up
Hourly Indicators
Bearish divergences
13 HR RSI
59
14 HR DMI
+ve
Daily Analysis
Consolidation b4 one more rise
Resistance
1.0875 - Dec high (08)
1.0820 - 50% r of 1.1300-1.0341
1.0774 - Intra-day high (reuters)
Support
1.0707 - Y'day's NY low
1.0689 - Y'day's low (NZ)
1.0625 - Last Fri's low
-
EUR/USD - 1.0758.. Euro climbed shortly after Mon open on renewed usd's weakness, price penetrated last week's 1.0719 high n rallied to a 6-week top of 1.0755 in Europe b4 retreating to 1.0707. Price later rose to 1.0769 in NY.
-
On the bigger picture 1st, despite euro's breach of 2015 12-year bottom at 1.0457 to a near 14-year low of 1.0367 at the start of Jan, subsequent erratic rise abv 1.0655 has 'violated' recent downward series of lower lows n lower highs n last Tue's gain to 1.0719 confirms recent downtrend has indeed formed a low at 1.0341. Current rising technical indicators suggest price is en route to 1.0820 being a 'natural' 50% r of MT intermediate fall fm 1.1300-1.0341, then twd 1.0875 (Dec high). On the downside, only below 1.0580/89 sup signals temp. top is made n risk stronger correction to 1.0530, possibly twd 1.0485, being 50% n 61.8% r respectively of the aforesaid rise fm 1.0341-1.0719.
-
Today, euro's gain to 1.0774 in Australia has retained daily bullishness for further rise to 1.0805, however, as hourly indicators would display 'bearish divergences' on such rise, reckon upside would falter well below Dec's peak at 1.0875. On the downside, only below 1.0707 signals temp. top made, 1.0650/55.
Interested in EUR/USD technicals? Check out the key levels
Author

AceTrader Team
AceTrader
Led by world-renowned technical analyst Wilson Leung, we have a team of 7 analysts monitoring the market and updating our recommendations and commentaries 24 hours a day.


