Technical position ahead of ECB
EUR/USD:
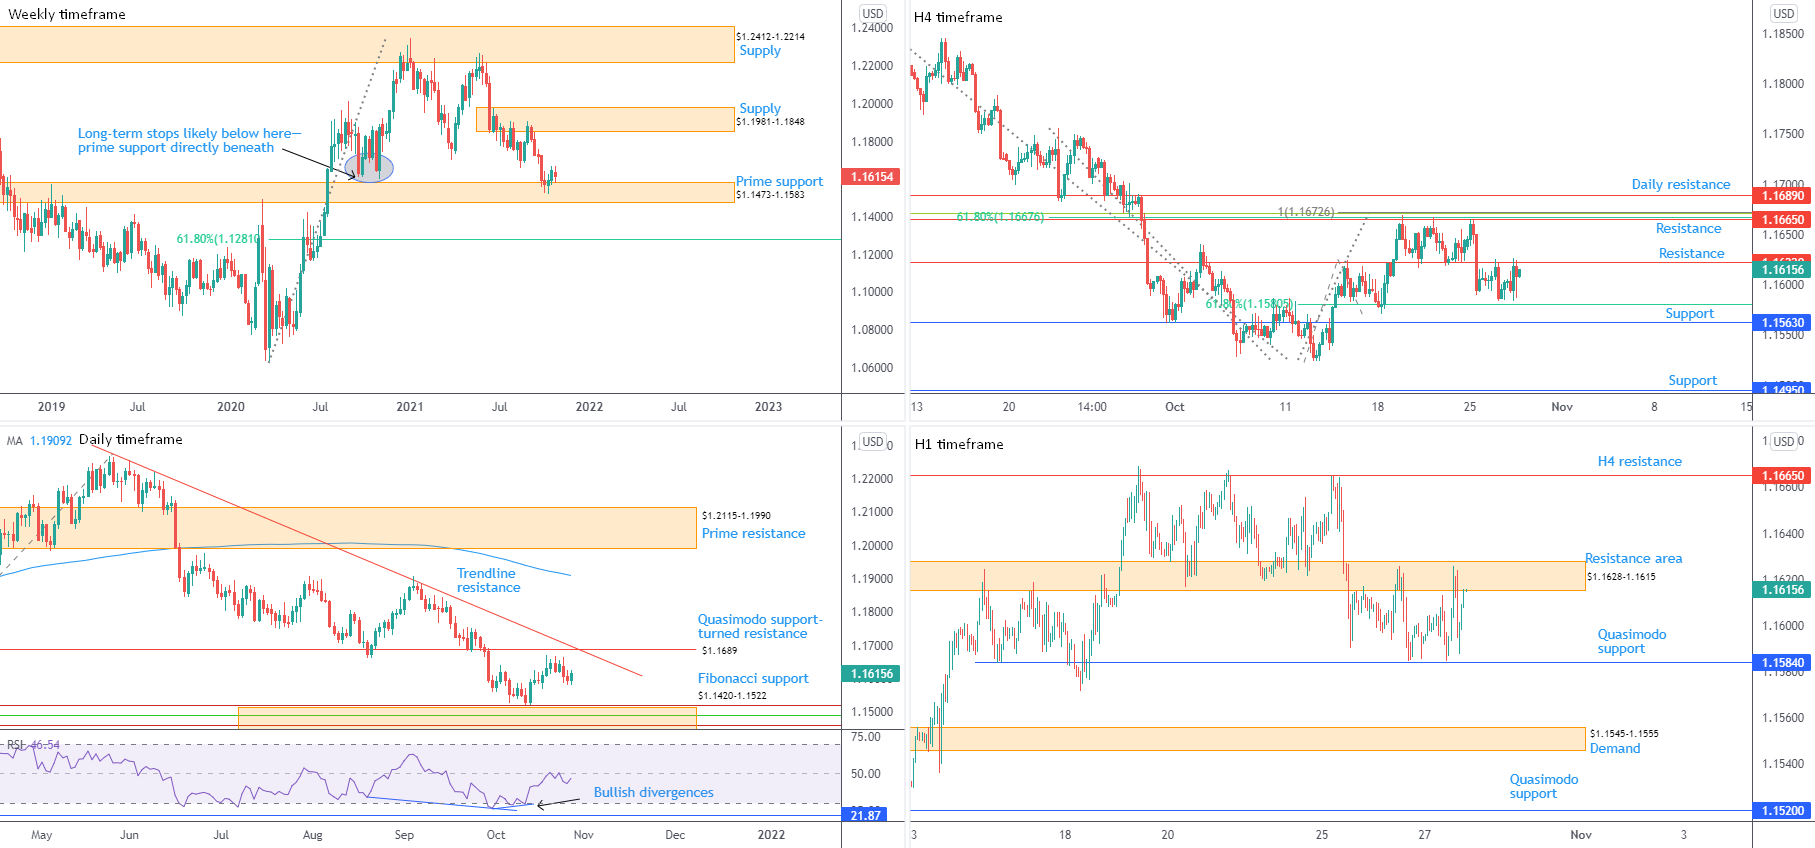
Weekly timeframe:
Prime support at $1.1473-1.1583 remains a focal point on the weekly scale. The response so far, however, has been uninspiring.
Buyers could eventually jump on the back of long-term sell-stops tripped beneath lows at $1.1612 (2020), with $1.1981-1.1848 supply recognised as the next upside objective. In the event buyers fail to agree higher prices, south of current support shines the technical spotlight on a 61.8% Fibonacci retracement at $1.1281.
Daily timeframe:
Technical structure directs focus towards Quasimodo support-turned resistance at $1.1689, sharing chart space with trendline resistance, taken from the high $1.2254. Lower on the curve, Fibonacci support falls in between $1.1420-1.1522.
The relative strength index (RSI) continues to test the mettle of the 50.00 centreline, following a reasonably decisive run out of oversold from mid-October. Overthrowing this line informs traders that average gains exceed average losses and momentum is to the upside, while 50.00 offering resistance suggests bears could put in another appearance.
In terms of trend, sentiment has favoured downside since June.
H4 timeframe:
Resistance at $1.1622 has proven a stubborn ceiling of late, surviving back-to-back upside attempts Tuesday and Wednesday. Maintaining position south of the aforementioned resistance throws light on a 61.8% Fibonacci retracement at $1.1581, followed by another support coming in from $1.1563.
H1 timeframe:
Treading water ahead of the ECB monetary policy decision, Europe’s single currency is in the process of forming a consolidation against its US counterpart, bound by resistance from $1.1628-1.1615 (houses H4 resistance at $1.1622) and the upper space of Quasimodo support at $1.1584.
Outside of the noted range, H4 resistance at $1.1665 is a key watch, with H4 support at $1.1563 visible to the downside, plotted just ahead of H1 demand from $1.1545-1.1555.
Observed Technical Levels:
Intraday movement is largely dependent on today’s ECB decision.
Technically, the currency pair exhibits a rangebound environment on H4 and H1 timeframes between H1 resistance at $1.1628-1.1615 and H1 Quasimodo support at $1.1584. Therefore, range traders may pull towards range extremes.
Longer term, the weekly picture puts forward support at $1.1473-1.1583, though before buyers can stretch their legs, consuming resistance at $1.1689 on the daily timeframe is required.
AUD/USD:
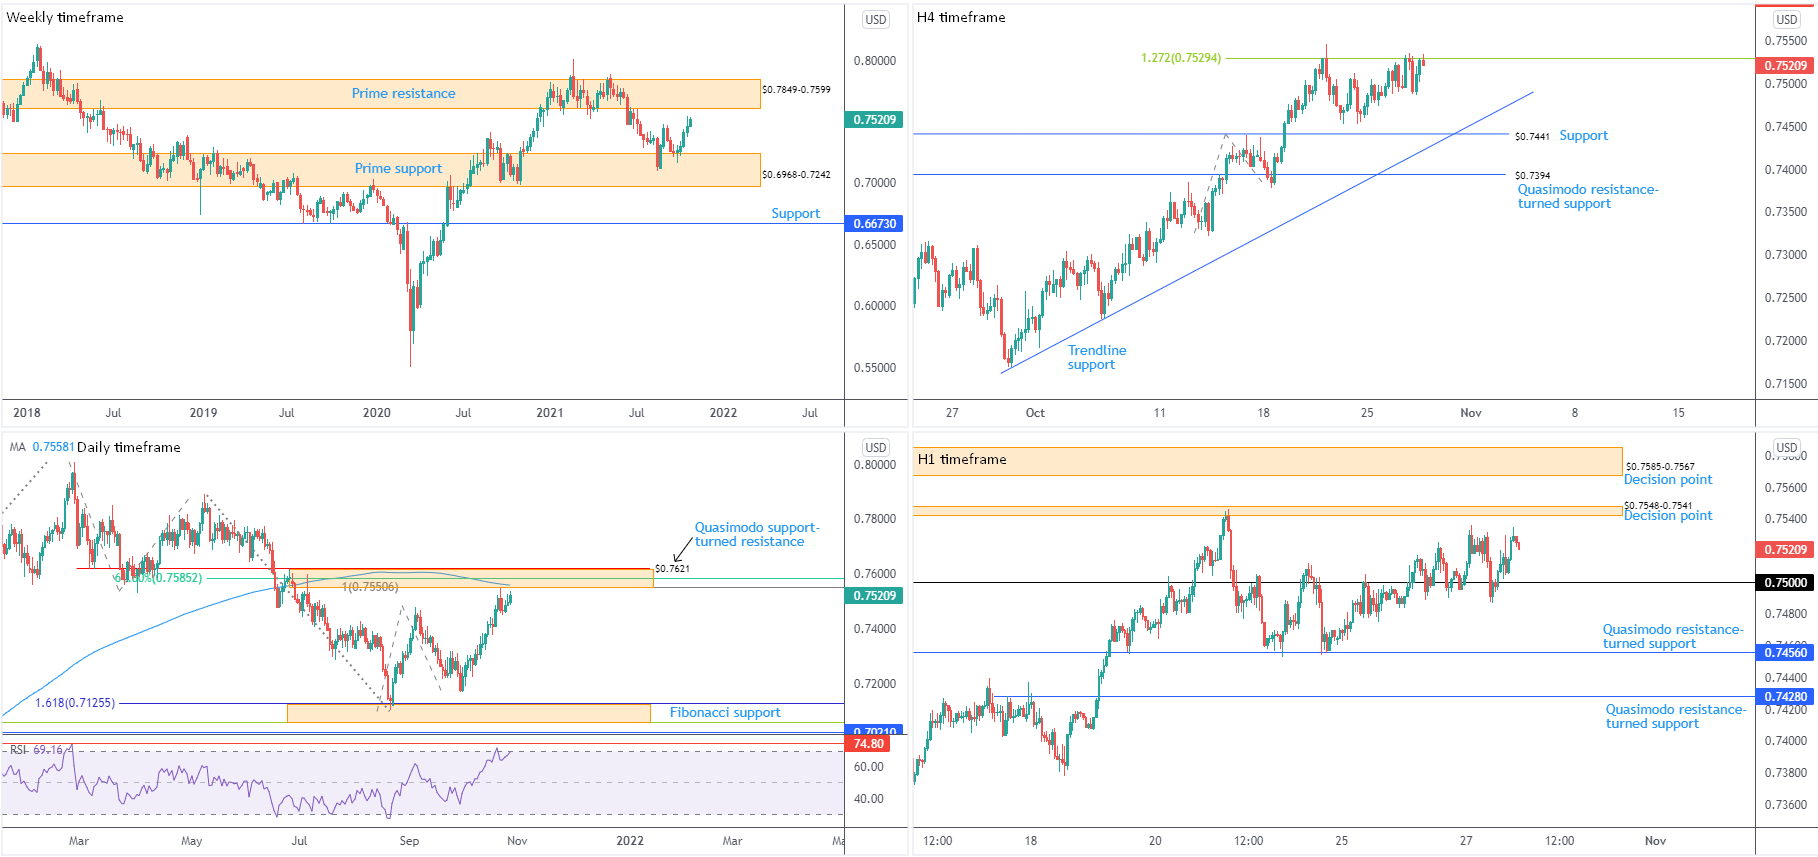
Weekly timeframe:
AUD/USD bulls remain bound for prime resistance at $0.7849-0.7599, on track to forge a fifth consecutive week in the green since departing from prime support from $0.6968-0.7242 at the end of September.
Trend studies on the weekly scale show we’ve been higher since early 2020. Consequently, the response from $0.6968-0.7242 might be the start of a dip-buying attempt to join the current uptrend, perhaps eventually overrunning $0.6968-0.7242 and challenging the yearly top at $0.8007.
Daily timeframe:
Price continues to hover beneath resistance between $0.7621 and $0.7551—made up of a Quasimodo support-turned resistance at $0.7621, the 200-day simple moving average at $0.7558, as well as a 61.8% Fibonacci retracement at $0.7585 and a 100% Fibonacci projection at $0.7551. Interestingly, noted resistance is fastened to the lower boundary of weekly prime resistance mentioned above at $0.7849-0.7599.
The relative strength index (RSI) welcomed overbought territory in recent days, highlighting indicator resistance at 74.80.
With respect to trend on the daily scale, last week probed fresh highs, helping to confirm the current upside bias.
H4 timeframe:
$0.7599 Quasimodo resistance calls for attention should the 1.272% Fibonacci projection at $0.7529 give way. In the event sellers step forward, support at $0.7441 is seen, closely shadowed by trendline support, taken from the low $0.7170.
H1 timeframe:
$0.75 continues to deliver a supportive base, with price perhaps calling for a retest of nearby decision point at $0.7548-0.7541, shadowed by an additional decision point coming in at $0.7585-0.7567.
Below $0.75, Quasimodo resistance-turned support is at $0.7456.
Observed Technical Levels:
Scope to discover higher terrain on the weekly scale until reaching prime resistance at $0.7849-0.7599, and resistance not expected to show on the daily timeframe until $0.7621-0.7551, the $0.75 figure on the H1 offering support should not surprise.
Overthrowing the H1 decision point at $0.7548-0.7541 is a possibility, targeting the H1 decision point from $0.7585-0.7567, which happens to be set within daily resistance mentioned above at $0.7621-0.7551.
USD/JPY:
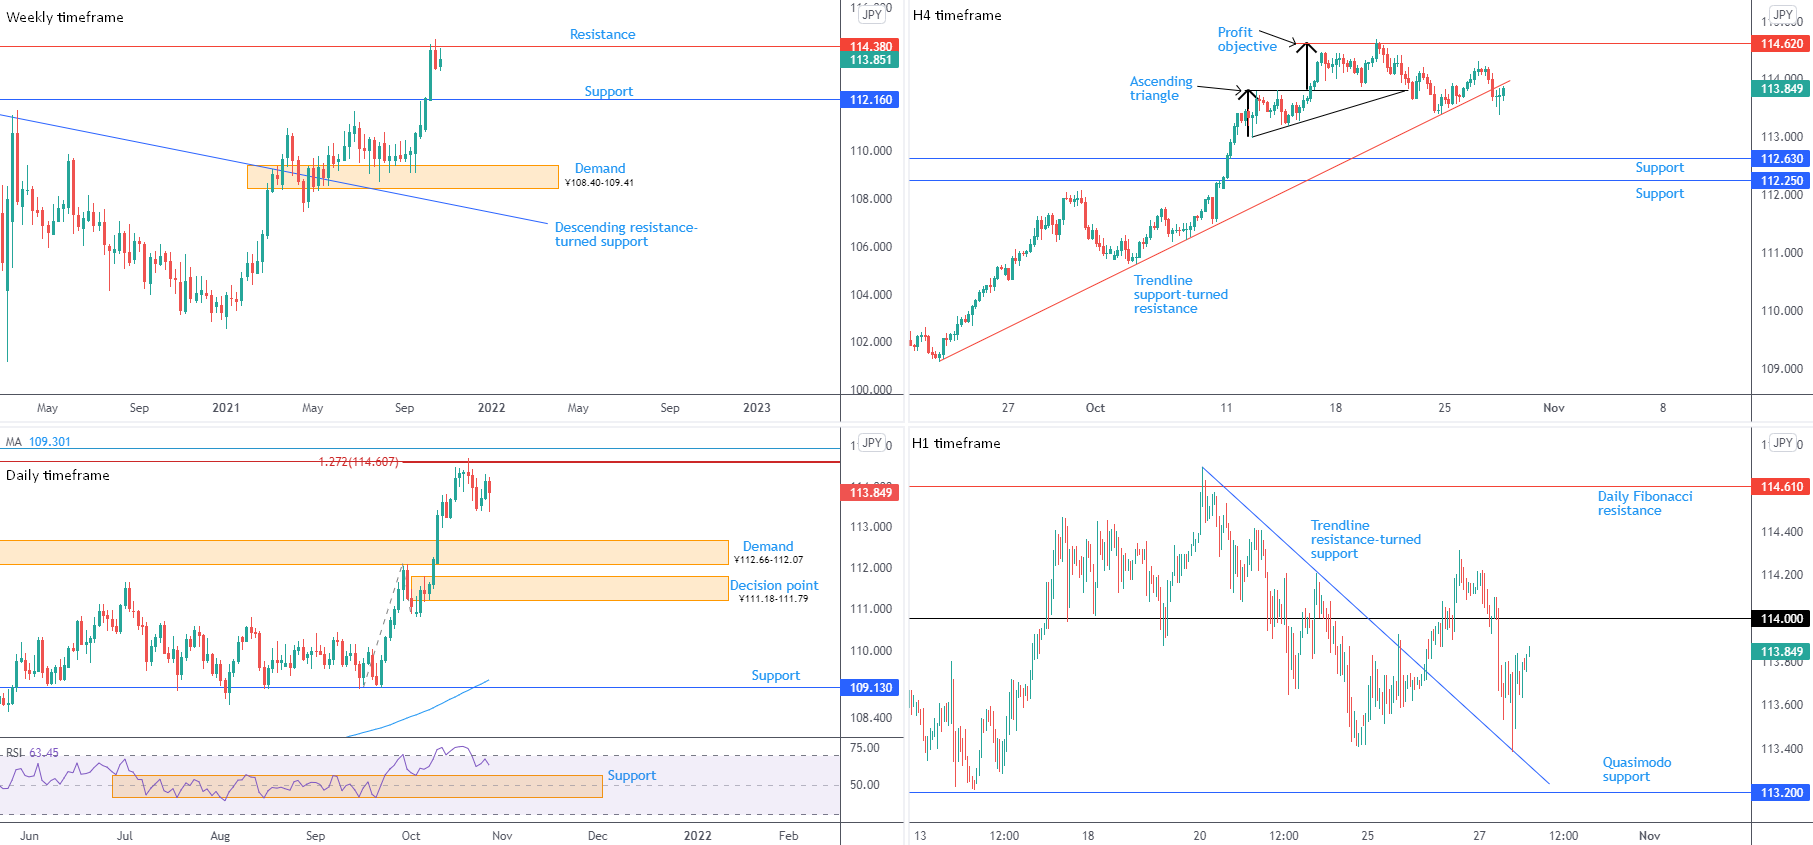
Weekly timeframe:
Nestled at the underside of resistance from ¥114.38, USD/JPY snapped a five-week bullish phase last week and touched a fresh three-year peak of ¥114.70.
A decisive reaction from resistance sets the stage for bringing in support at ¥112.16.
In terms of trend, we’ve been advancing since the beginning of this year.
Daily timeframe:
The Fibonacci cluster, made up of two 1.272% Fibonacci projections at ¥114.63 and ¥114.61, set a handful of pips beneath a deep 78.6% Fibonacci retracement at ¥114.94, continues to command attention on the daily timeframe. Price touched a low of ¥113.39 amidst Wednesday’s movement, with subsequent follow-through action pointing to supply-turned demand at ¥112.66-112.07.
The noted resistance area, along with weekly resistance highlighted above at ¥114.38, is clearly a headwind for the currency pair right now.
From the relative strength index (RSI), the indicator’s value recently exited overbought space and appears poised to retest 56.85 support—prior range resistance.
H4 timeframe:
Out of the H4 chart, trendline support, taken from the low ¥109.12 was engulfed, revealing two support levels at ¥112.25 and ¥112.63. This followed last week’s test of an ascending triangle’s (low: ¥113 high: ¥113.79) profit objective (thick black arrows) at ¥114.62.
H1 timeframe:
Price movement aggressively dropped through ¥114 heading into London on Wednesday, subsequently challenging a trendline resistance-turned support, drawn from the high ¥114.70. Of technical note is Quasimodo support tucked just under the aforesaid trendline support at ¥113.20.
What’s interesting about the said Quasimodo is it’s also located a touch south of October 13th lows around ¥113.22. For that reason, testing ¥113.20 will trip a portion of sell-stops and help fuel willing bids.
Observed Technical Levels:
Wednesday’s break of trendline support on the H4 timeframe helps confirm bearish intent from weekly resistance at ¥114.38 and the daily timeframe’s Fibonacci cluster between ¥114.94 and ¥114.61. This places the lower side of ¥114 in the spotlight as potential resistance, and is an area sellers could welcome to target H1 Quasimodo support at ¥113.20.
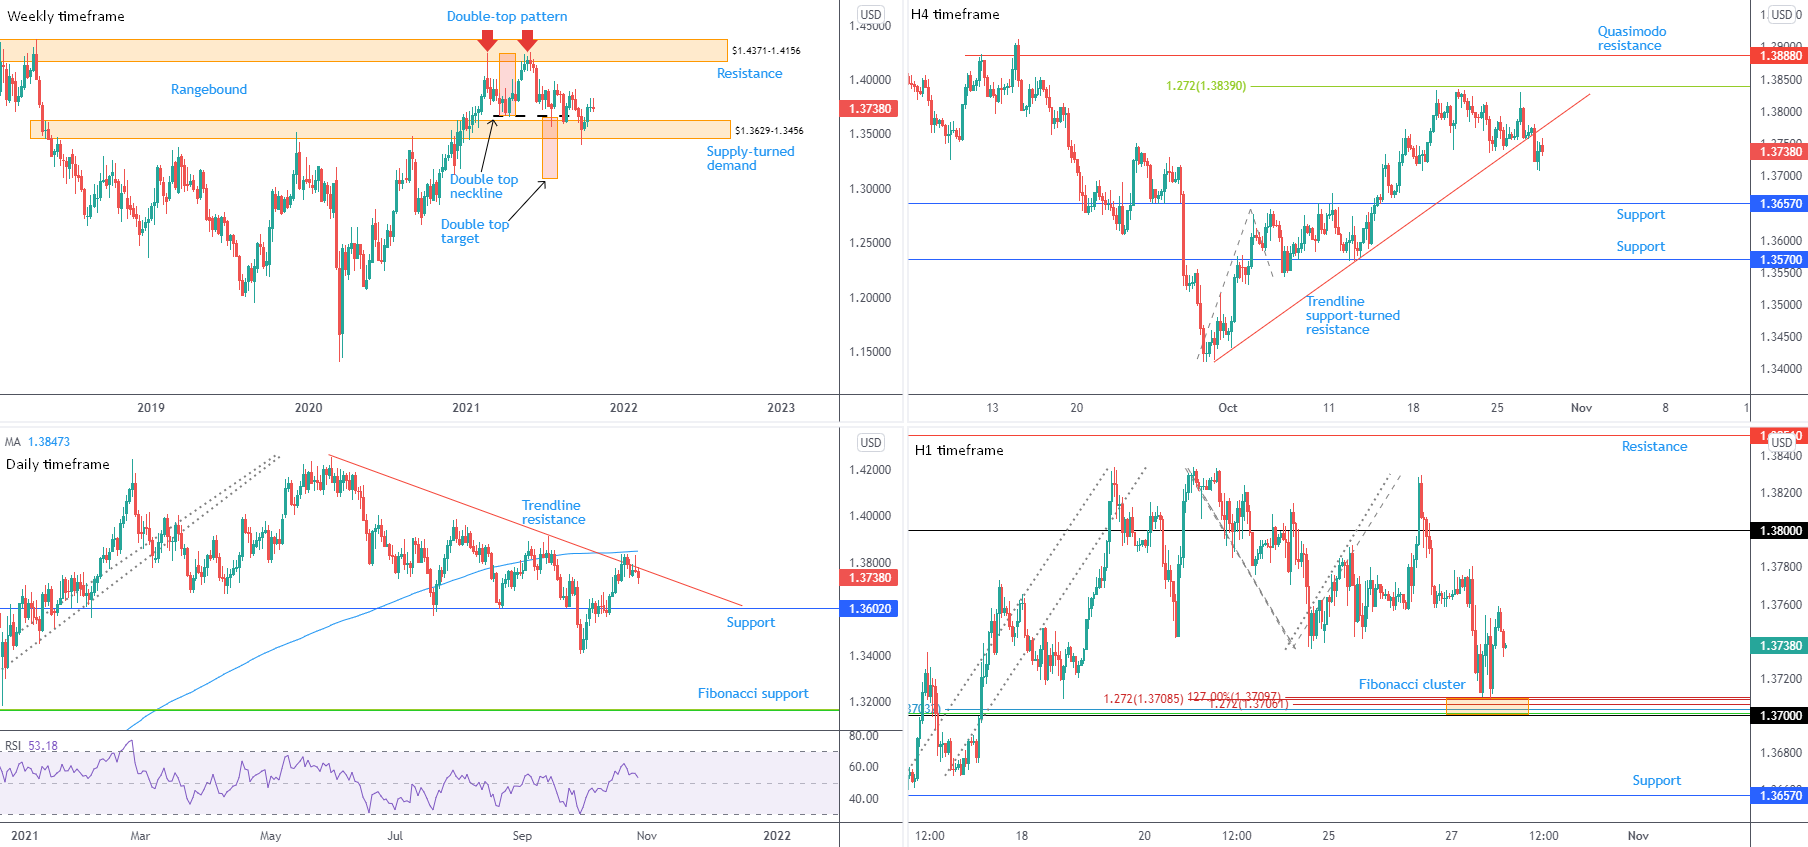
GBP/USD:
Weekly timeframe:
Despite dipping a toe south of supply-turned demand at $1.3629-1.3456 in late September, and closing under a double-top pattern’s ($1.4241) neckline at $1.3669, GBP/USD bulls have been healthy in October, up 2.0 percent MTD.
Should sellers regain consciousness, the double-top pattern’s profit objective—measured by taking the distance between the highest peak to the neckline and extending this value lower from the breakout point—sits around $1.3093.
Daily timeframe:
Trendline resistance, a descending line taken from the high $1.4250, donated a technical ceiling in recent candles—structure arranged a handful of pips beneath the 200-day simple moving average at $1.3847. Establishing a bearish presence has support from $1.3602 to target.
The relative strength index (RSI) is on the verge of crossing paths with the 50.00 centreline, an area delivering sound support/resistance since April.
With reference to the current trend, despite the weekly timeframe displaying an upside bias, sentiment is directed lower for now, shaped in the form of lower highs and lower lows from June 1st top at $1.4250.
H4 timeframe:
Pencilling in a top just ahead of a 1.272% Fibonacci extension at $1.3839, Wednesday stepped beneath trendline support, extended from the low $1.3415. Clear support resides at $1.3657, echoing a bearish vibe on this timeframe until the latter is met.
H1 timeframe:
A tight Fibonacci cluster between $1.3701 and $1.3710 made its presence felt on Wednesday, welcoming recovery gains amid US hours. According to H1 price structure, limited resistance is evident until connecting with $1.38. Downstream, nonetheless, the H4 support is visible at $1.3657.
Observed Technical Levels:
Despite the H1 timeframe’s Fibonacci cluster between $1.3701 and $1.3710 attracting a bullish reaction, further outperformance is unlikely. This is due to the H4 timeframe snapping beneath trendline support, in addition to the daily timeframe responding from trendline resistance. With that being the case, a bearish scenario could unfold upon forming a H1 close beneath the $1.37ish region, taking aim at H4 support from $1.3657.
Author

Aaron Hill
FP Markets
After completing his Bachelor’s degree in English and Creative Writing in the UK, and subsequently spending a handful of years teaching English as a foreign language teacher around Asia, Aaron was introduced to financial trading,


