Technical outlook ahead of UK inflation data

EUR/USD:
Weekly timeframe:
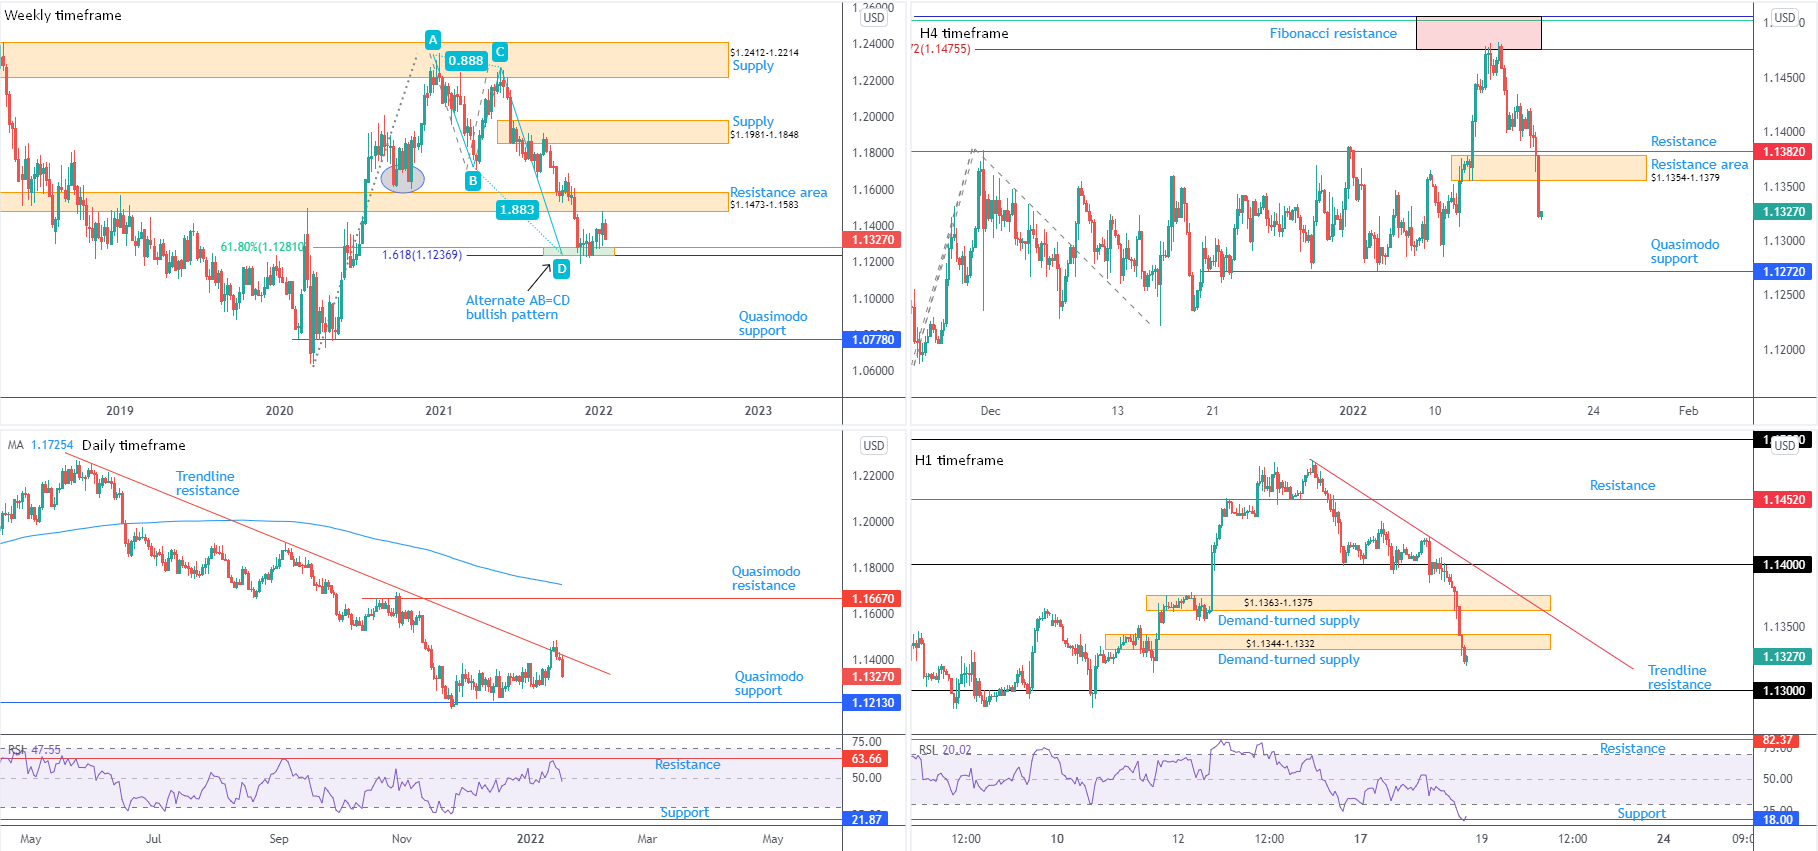
Long-standing resistance from $1.1473-1.1583 (active S/R since late 2017) entertained a bearish showing last week, with price currently down by 0.8 percent so far this week.
Downstream, familiar support resides at $1.1237-1.1281. Made up of a 61.8% Fibonacci retracement at $1.1281 and a 1.618% Fibonacci projection from $1.1237, this area, as you can see, delivered a floor heading into the close of 2021. ‘Harmonic’ traders will acknowledge $1.1237 represents what’s known as an ‘alternate’ AB=CD formation (extended D leg).
Strengthening the aforementioned resistance area, the pair took out 2nd November low (2020) at $1.1603 in late September (2021), suggesting a downtrend on the weekly timeframe. This is reinforced by the monthly timeframe’s primary downtrend since mid-2008.
Daily timeframe:
Following Friday’s whipsaw above a 7-month trendline resistance, extended from the high $1.2254, established by way of a bearish engulfing candle (a reversal pattern in which focus is directed to the real candle body rather than upper and lower shadows), Europe’s single currency plunged south against a broadly stronger dollar yesterday.
Should bearish follow-through emerge, Quasimodo support offers an obvious target at $1.1213.
Momentum studies, derived through the relative strength index (RSI), supports additional downside on this timeframe, marginally crossing under the 50.00 centreline (average losses outweighing average gains: negative momentum).
Trend on this scale has been lower since June 2021.
H4 timeframe:
Support from $1.1382 and the decision point at $1.1354-1.1379 experienced a one-sided breach Tuesday, leaving behind clear resistance areas to be mindful of. This was a noted move to be aware of, given higher timeframe technical structure (see above).
Knocking on the door of Quasimodo support at $1.1272 is now on the table if sellers strengthen their grip. Yet, before rotating lower, retesting the aforementioned resistances could be seen.
H1 timeframe:
A dominant USD bid, supported by rising US Treasury yields and major US equity indexes plunging, guided EUR/USD through a number of pivotal demand areas on Tuesday. Upbeat economic data out of Europe as well as soft US economic numbers had limited effect.
Consequently, short-term action is on the doorstep of $1.13, while any upside attempts must confront demand-turned supply at $1.1344-1.1332 and $1.1363-1.1375.
Out of the relative strength index (RSI), the value is shaking hands with indicator support within oversold territory at 18.00. This is a location some chartists will anticipate a slowing of downside momentum. Exiting oversold, therefore, may be watched.
Observed Technical Levels:
H1 price movement approaching $1.13 unlocks the door to a potential whipsaw into the upper wall of weekly support at $1.1281. A subsequent H1 price close back above $1.13, therefore, may be viewed as a bullish signal. Prior to this, watch for possible retests of demand-turned supply at $1.1344-1.1332 and $1.1363-1.1375 on the H1.
AUD/USD:
Weekly timeframe:
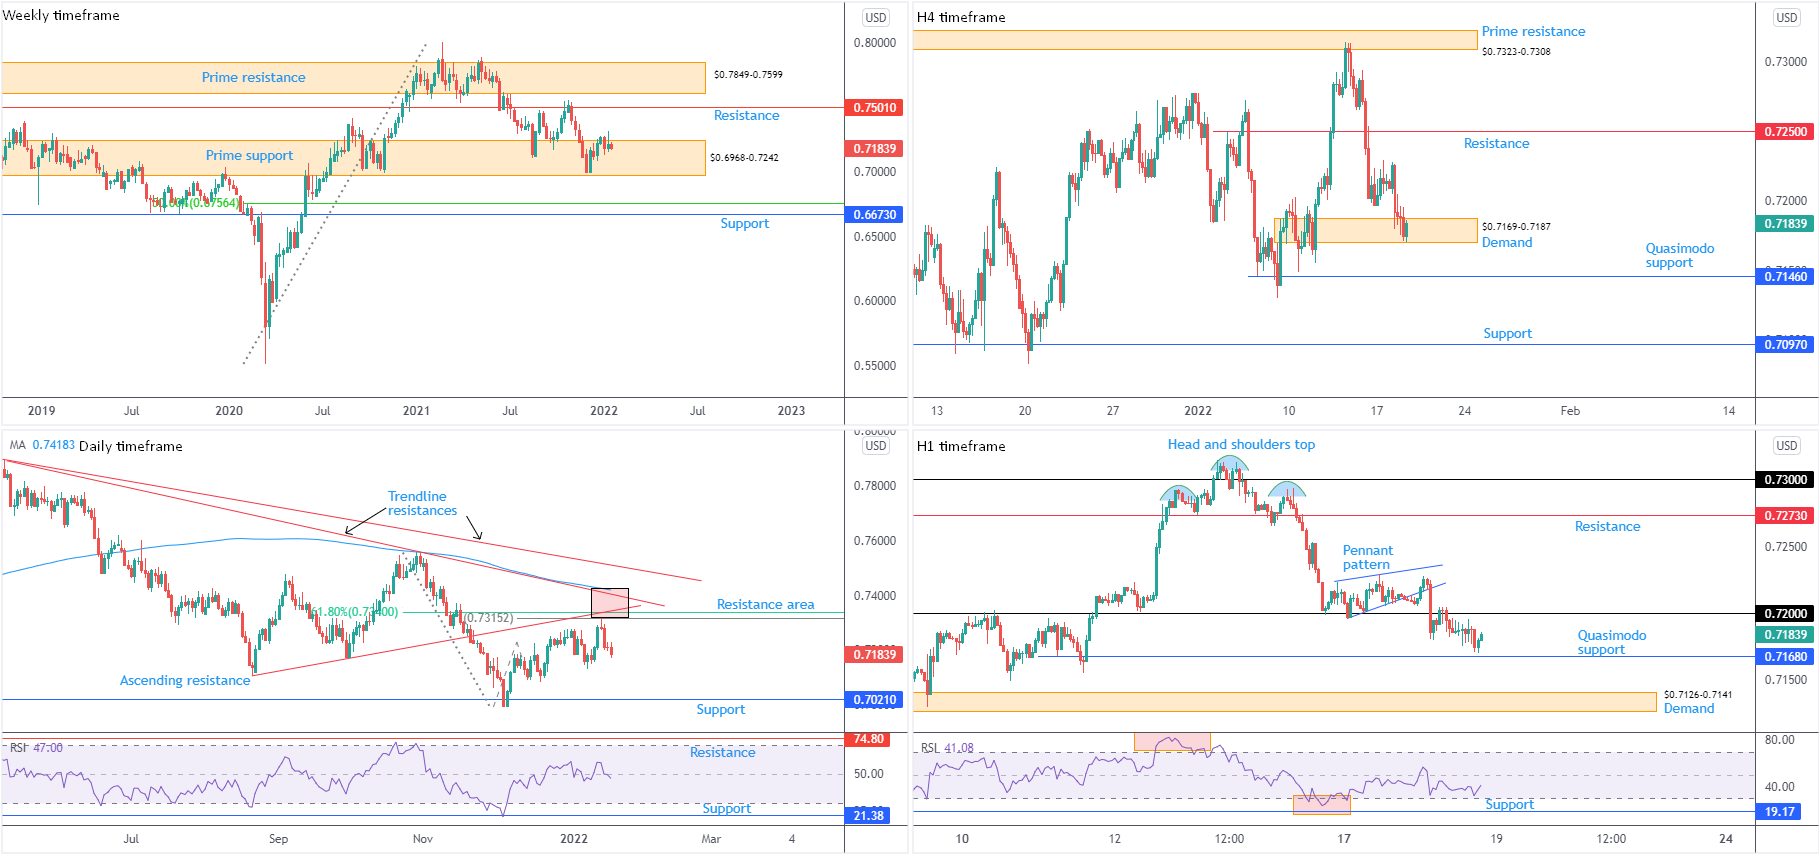
Prime support at $0.6968-0.7242 continues to play a crucial role on the weekly timeframe. Bulls, as you can see, embraced a modestly bullish stance into the close of 2021. 2022, on the other hand, has been undecided so far. Should buyers continue pressing higher, resistance is formed at $0.7501. Manoeuvring beneath $0.6968-0.7242 reveals support at $0.6673 and a 50.0% retracement at $0.6756.
Since mid-Feb 2021, a modest downside bias has been seen. This followed higher prices since pandemic lows of $0.5506 (March 2020). However, it is important to note that from the monthly timeframe the unit has been entrenched within a large-scale downtrend from mid-2011.
Daily timeframe:
Following the near-test of resistance between $0.7418 (the 200-day simple moving average) and $0.7315 (a 100% Fibonacci projection at $0.7315), continuation selling unfolded. Aside from the $0.7130 low (7th January) and the $0.7082 (20th December [2021]) low, obvious support at $0.7021 calls for attention.
The relative strength index (RSI) continues to circle the 50.00 centreline. $0.7418-0.7315 sellers, therefore, will likely be watching for the indicator to secure position beneath the 50.00 neighbourhood, movement informing market participants that average losses exceed average gains.
H4 timeframe:
$0.7169-0.7187 demand put in an appearance on Tuesday and, within the lower range of the aforementioned area, has begun to show some ‘bullish life’. Unlikely sufficient to fuel buyer confidence, traders are urged to pencil in the possibility of dipping lower and connecting with neighbouring Quasimodo support at $0.7146. In the event buyers gain footing, resistance can be seen at $0.7250.
H1 timeframe:
Early hours Tuesday witnessed a decisive decline through the lower boundary of a pennant formation ($0.7223 and $0.7196) and $0.72. Shortly following a retest of $0.72, recent hours clocked a low just ahead of Quasimodo support at $0.7168. Territory beneath the latter shines the technical spotlight on demand at $0.7126-0.7141, arranged a handful of pips under H4 Quasimodo support mentioned above at $0.7168.
As for the relative strength index (RSI), we remain exploring waters south of the 50.00 centreline after failing to find acceptance above the latter early trade.
Observed Technical Levels:
Subdued buying within prime support at $0.6968-0.7242 on the weekly timeframe and scope to navigate lower on the daily timeframe places a question mark on H4 demand at $0.7169-0.7187. As a result, $0.72 drawing resistance should not surprise.
USD/JPY:
Weekly timeframe:
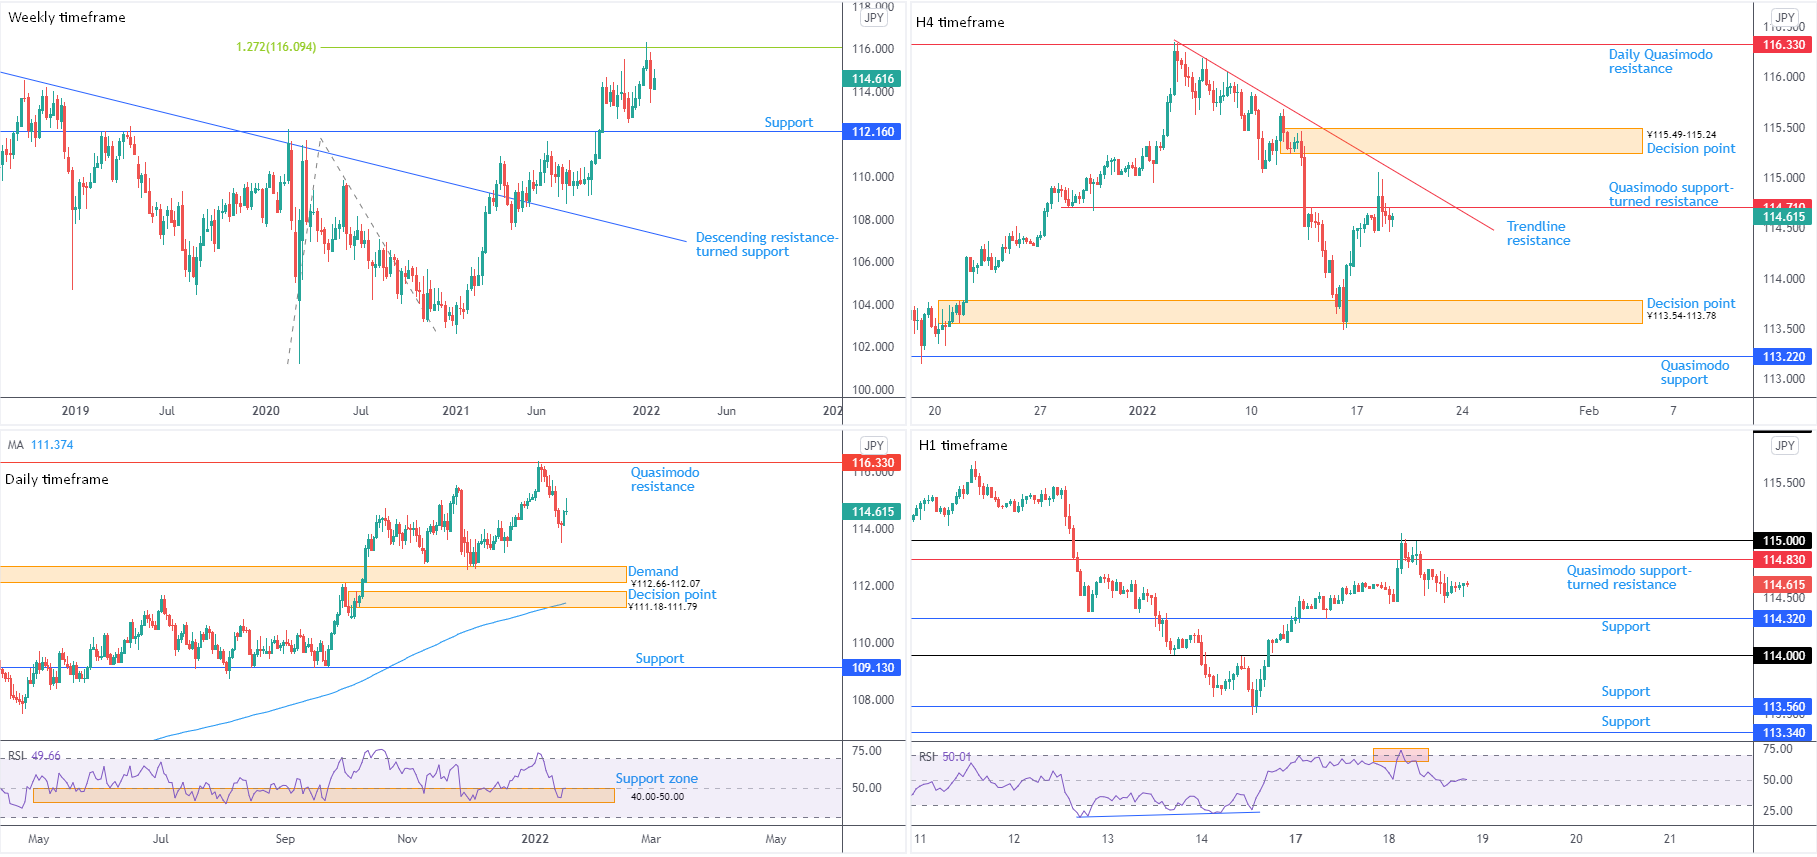
After touching gloves with a 1.272% Fibonacci projection from ¥116.09 in the shape of a shooting star and refreshing multi-year pinnacles, USD/JPY tumbled 1.2 percent last week. While modest recovery efforts developed in recent trading, the path of least resistance remains to the downside towards support at ¥112.16.
In terms of trend, the unit has been advancing since the beginning of 2021, welcoming a descending resistance breach, drawn from the high ¥118.61. In consideration of the trend, a dip-buying theme from ¥112.16 is a reasonable assumption.
Daily timeframe:
Tuesday settled in the shape of a shooting star candlestick formation. This follows Friday’s hammer pattern and Monday’s subsequent bullish follow-through.
The technical framework to be mindful of on this chart has Quasimodo resistance to target at ¥116.33, whereas downstream shines light on demand at ¥112.66-112.07, tailed closely by a decision point from ¥111.18-111.79 and the 200-day simple moving average at ¥111.37.
In terms of the relative strength index (RSI), support between 40.00 and 50.00 (a ‘temporary’ oversold range since 10th May) remains active.
Much like the weekly timeframe, trend on the daily scale points to the upside.
H4 timeframe:
Quasimodo support-turned resistance at ¥114.71 elbowed into the frame Tuesday and, albeit not to the pip, held back buyers. The whipsaw above resistance topped within a stone’s throw of trendline resistance, taken from the high ¥116.35, and a decision point from ¥115.49-115.24.
Pursuing lower prices highlights a familiar decision point at ¥113.54-113.78, set a few pips above Quasimodo support at ¥113.22.
H1 timeframe:
Ahead of the close, USD/JPY leaves behind a subdued tone, in spite of rising US Treasury yields and healthy USD demand, together with a dovish Bank of Japan (BoJ).
For those who read Tuesday’s technical briefing you may recall the following (italics):
Between H4 Quasimodo support-turned resistance at ¥114.71 and H1 Quasimodo support-turned resistance at ¥114.83, sellers could be drawn to this area (some traders are likely to include the ¥115 figure in this resistance zone).
As evident from the H1 chart, price did indeed welcome a ¥115 test on Tuesday and resigned to lows of ¥114.50ish. Support calls at ¥114.32, with a break shifting attention to the ¥114 figure. Note, ¥115 was accompanied by an overbought signal; the indicator has since crossed swords with the 50.00 centreline, threatening possible movement in the direction of oversold levels.
Observed Technical Levels:
Short term, H4 Quasimodo support-turned resistance at ¥114.71 holding, together with the ¥115 figure also serving well as resistance, could influence a bearish scene towards H1 support at ¥114.32 and, with a little ‘oomph’, ¥114.
GBP/USD:
Weekly timeframe:
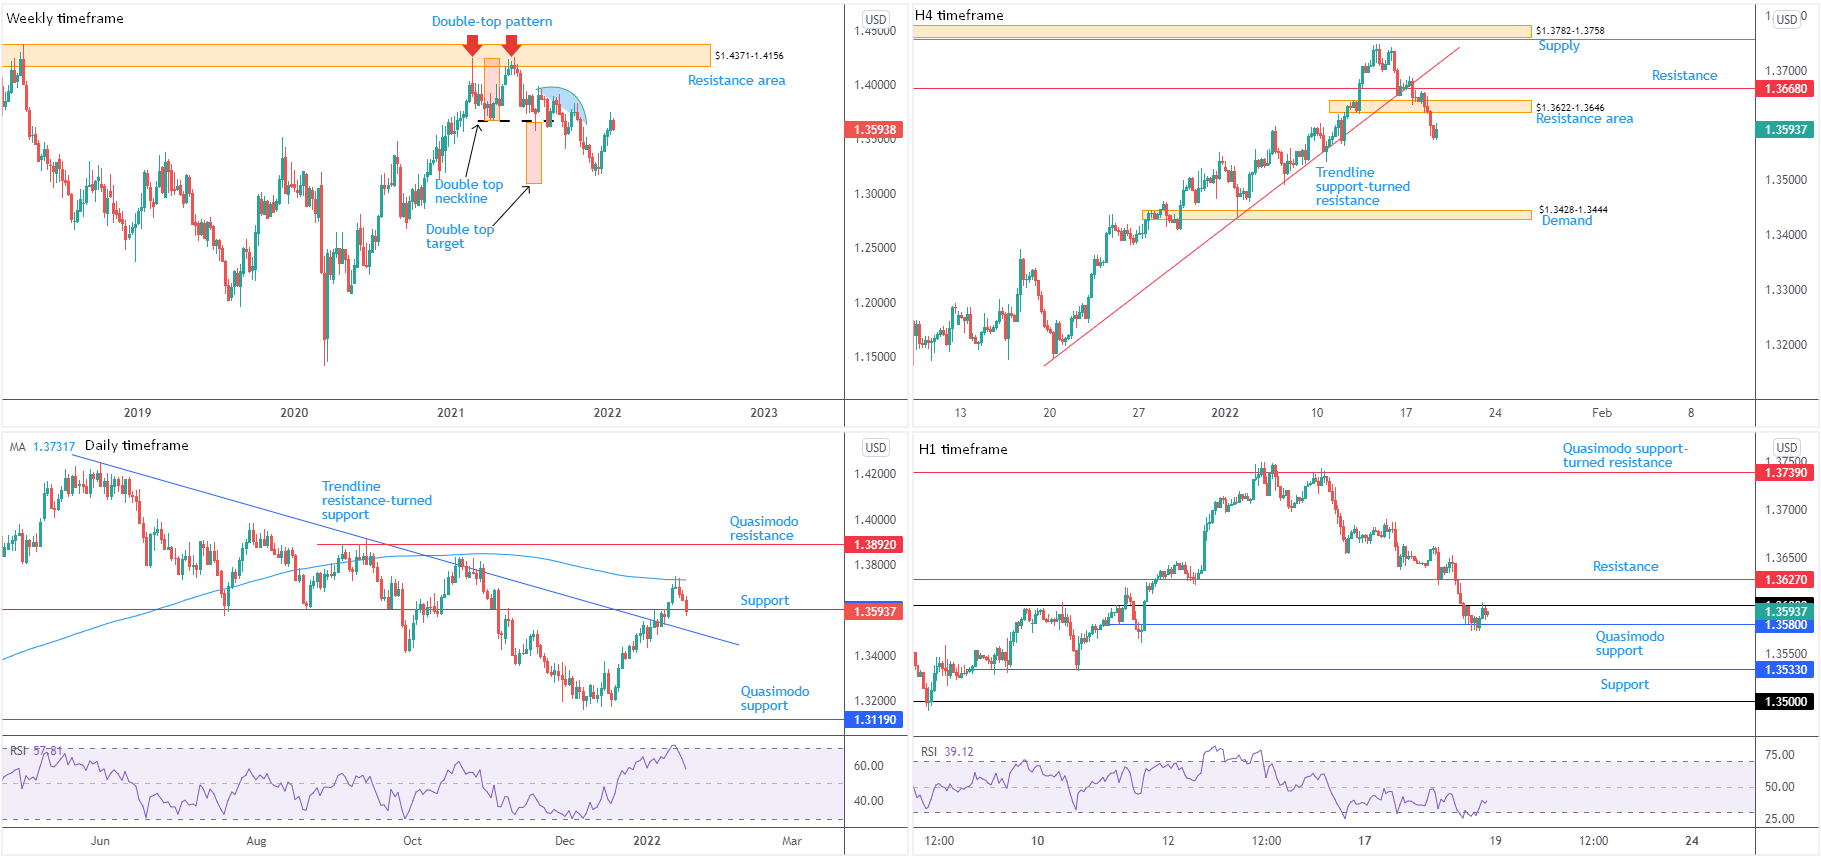
The current 4-week bid—initiated ahead of the double-top pattern’s ($1.4241) profit objective around $1.3093 (red boxes)—is echoing a weaker tone this week, down 0.6 percent.
‘Consumed supply’ (blue area) is nearby between $1.4001 and $1.3830. Considering this, candle action may still be guided as far north as resistance from $1.4371-1.4156 in the coming weeks.
In regards to trend, the weekly timeframe’s position shows higher prices since early 2020. However, it’s important to recognise that while the trend on the weekly timeframe demonstrates an upside bias, the monthly timeframe’s long-term trend has been lower since late 2007.
Daily timeframe:
Three back-to-back daily bearish candles materialised after touching the lower side of the 200-day simple moving average at $1.3732.
Observed support at $1.3602 has consequently come under attack. Ceding ground here unbolts the technical space for neighbouring trendline resistance-turned support to make a show, taken from the high $1.4250.
The relative strength index (RSI) recorded overbought conditions in line with price testing the noted SMA and has since exited the area. This—coupled with the value fast approaching the 50.00 centreline—is considered by many technicians as a sign upside momentum is beginning to slow. Crossing under the 50.00 zone helps confirm a bearish stance.
H4 timeframe:
The decision point at $1.3622-1.3646 put up little fight on Tuesday, leaving nearby resistance at $1.3668 unopposed. Below the decision point, aside from a number of ‘local’ lows, demand is at $1.3428-1.3444.
Ultimately, this timeframe exhibiting scope to travel lower works alongside the daily timeframe recently cracking support at $1.3602.
H1 timeframe:
The latest round of downside movement on GBP/USD, amidst demand for the US dollar on the back of rising US Treasury yields, watched candle action pull through $1.36 to test nearby Quasimodo support at $1.3580. Under the latter, assuming $1.36 maintains resistance, chart studies show price could zero in on support from $1.3533 and maybe $1.35.
The relative strength index (RSI) rose from oversold space and is nearing 40.00. Note that the indicator has chalked up a ‘temporary’ overbought zone between 50.00 and 40.00, given the markets immediate downside bias since last Thursday.
Observed Technical Levels:
The daily timeframe threatening to dethrone support at $1.3602, in association with H4 price pushing under $1.3622-1.3646 and the H1 kissing the lower side of $1.36, opens up a bearish theme. Conservative traders are likely to wait for H1 price to close below Quasimodo support at $1.3580 before committing, targeting H1 support at $1.3533 and $1.35 (aligns closely with the daily timeframe’s trendline resistance-turned support, taken from the high $1.4250).
Author

Aaron Hill
FP Markets
After completing his Bachelor’s degree in English and Creative Writing in the UK, and subsequently spending a handful of years teaching English as a foreign language teacher around Asia, Aaron was introduced to financial trading,


