Technical levels for this week - JPY, CHF and NZD

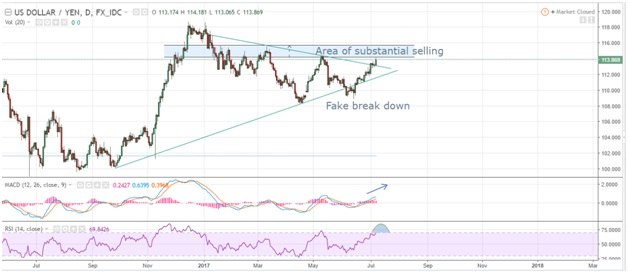
USD/JPY
The USD/JPY is set to climb to an important level at which sellers come in. We've seen this over and over again historically. The MACD indicator shows that there is still upwards momentum though and the RSI indicator signals that we are still not at an overpriced level, though even this would not indicate imminent cessation of buying pressure.
This pair has shown a propensity to break down below certain levels and then rebound so the price rising above the confluence of support and resistance should have no real bearing on the long-term direction of the currency. Indeed, as the USD/JPY is highly bound to investor sentiment, there are other factors at play that have a stronger influence rather than technical levels.
This pair should be expected to climb into a strong resistance level directly above and then stabilize. After that, it’s anybody's guess. A gambling man may sell the currency later this month or August on seasonal sentiment patterns.
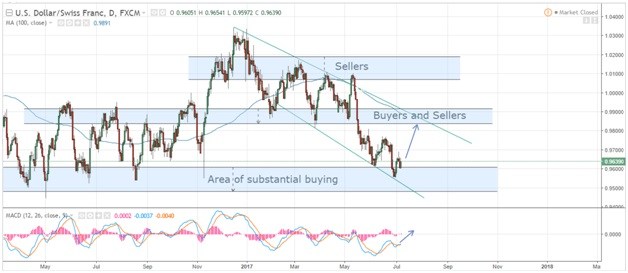
USD/CHF
This pair has been bouncing around between buyers and sellers for several years now as the Swiss Franc falls in and out of favour with risk hedgers. As with the JPY, the CHF is in demand as risk sentiment falls by the way side to make room for a risk-on phase which is likely to last until August or September. In this time we may see continued buying of USD, or more likely, CHF selling. The pair could rise to the downward trending resistance line which is also an area of selling.
This technical analysis is supported by the MACD indicator which has shown an uptick in buying momentum after a period of selling pressure. Importantly, as the SNB continues to maintain its loose monetary policy while the Fed continues its tightening policy, further employment gains and wage pressure in the US will continue to make traders think twice about selling the USD.
NZD/USD
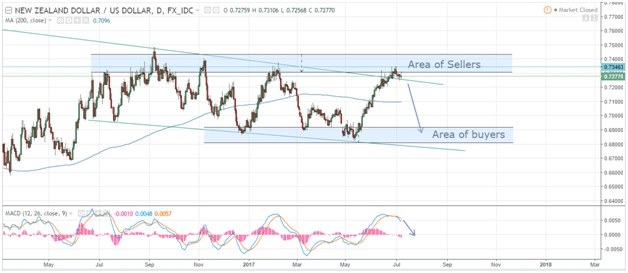
This pair has risen above resistance levels to an area where substantial sellers have come in historically. This area above the resistance line leading to NZD/USD indecision has produced a potential 'fakeout'. Meaning that the price falls back into the trading channel, buyers who bought at this level in the belief that it would continue higher, will be burnt. At the current level, selling is not advised as we are yet to have any real confirmation that a selling trend is underway, despite the MACD signalling downward momentum. The price has stalled after 7 weeks of continuous buying, so we can either say it's paused for a breather, or it's now overbought. In either case, keeping the “powder dry” may be the prudent decision here.
The New Zealand dollar may find it hard to climb higher due to its close relationship to the Australian and Chinese economy. Even though the NZ economy is performing well, growth concerns and high asset valuations in Australia and China may keep a lid on another NZD move higher for the time being.
Author

Adinah Brown
Leverate


