US-China trade negotiations may be delayed until the US presidential election

In this review, we suggest considering the composite gold instrument Gold vs S&P 500 Index. Will the XAUSnP rise? Such a movement is observed when gold prices rise, and the S&P 500 decreases.
Gold is a safe-haven asset and its prices rise in case of an increase in political risks. These risks have increased amid US President Donald Trump's statement that trade negotiations with China could last until the US presidential election in November 2020. Let us recall that on December 15, a number of duties on imports of Chinese goods to the US may be increased. This will strengthen tensions between the two countries. The other day, Donald Trump increased duties on steel and aluminum from Brazil and Argentina. Meanwhile, gold reserves in the largest SPDR Gold Trust fund have been at a minimum since mid-September of the current year and amount to 889.2 tons. At that time, gold was more expensive - about $1,500 per ounce. Recovery of reserves can positively affect gold prices. The US stock index S&P 500 has fallen by about 2.5% since the beginning of this week. The reaction to Donald Trump's statement was sharply negative. Besides, the ISM Manufacturing indicator for November, which turned out to be weak, was published on Monday. The U.S. employment report and an important Non-farm Payrolls indicator, which may affect the S&P 500, will be released on Friday.
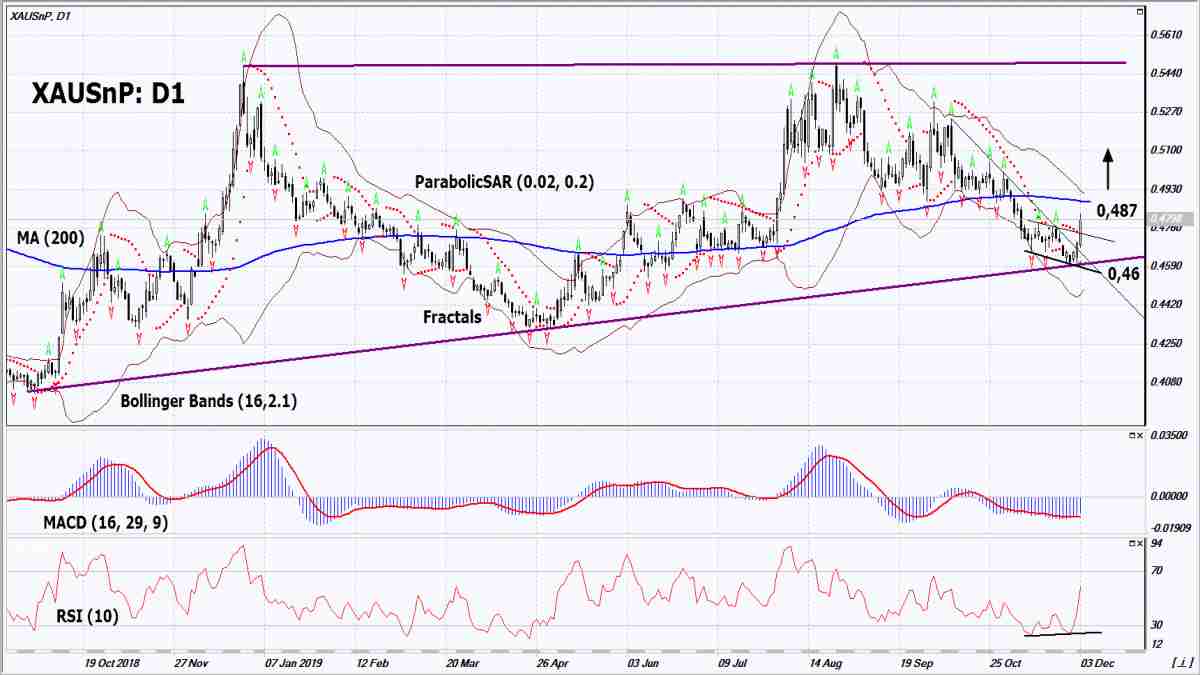
On the daily timeframe, XAUSnP: D1 is correcting up from the lower boundary of the long-term uptrend. It is the lower boundary of a large triangle. A number of technical analysis indicators formed buy signals. The further price increase is possible in case of the transfer of trade negotiations between China and the US and publication of weak corporate data in the US.
-
The Parabolic indicator gives a bullish signal
-
The Bollinger bands have narrowed, which indicates low volatility.
-
The lower Bollinger band is titled upward
-
The RSI indicator is above 50. It has formed a positive divergence. The MACD indicator gives a bullish signal.
The bullish momentum may develop in case XAUSnP exceeds the 200-day moving average line at 0.487. This level may serve as an entry point. The initial stop loss may be placed below the boundary of the triangle, the fractal low and the Parabolic signal at 0.46. After opening the pending order, we shall move the stop to the next fractal low following the Bollinger and Parabolic signals. Thus, we are changing the potential profit/loss to the breakeven point. More risk-averse traders may switch to the 4-hour chart after the trade and place there a stop loss moving it in the direction of the trade. If the price meets the stop level (0.46), without reaching the order (0.487), we recommend closing the position: the market sustains internal changes that were not taken into account.
Summary of technical analysis
| Position | Buy |
| Buy stop | Above 0.487 |
| Stop loss | Below 0.46 |
Want to get more free analytics? Open Demo Account now to get daily news and analytical materials.
Want to get more free analytics? Open Demo Account now to get daily news and analytical materials.
Author

Dmitry Lukashov
IFC Markets
Dimtry Lukashov is the senior analyst of IFC Markets. He started his professional career in the financial market as a trader interested in stocks and obligations.


