Technical Analysis USDIDX : 2017-01-10
Investors undecided on the direction of the market movement yet
The US dollar index is correcting down from its 14-year high recorded last week. Will it continue falling? Significant economic data in the US are expected only on Friday.
The weakening of the US dollar started on January 4, 2017 after the publication of the Fed December meeting minutes. They indicated a likelihood of an increase in inflation risks on the background of accelerated economic growth and possible reduction of the US corporate tax burden in case of an approval of the economic program of the new US president Donald Trump. Some investors even declared about the “overheating” risks of the US economy. Another factors in favor of the possible correction of the US dollar index may become data on the US labor market. In 2016, the average increase in the number of new jobs in nonfarm payrolls was 180, 000 per month. This is significantly less than the corresponding indictor of 2015 which was 229,000 per month. The slowdown in the creation of new jobs may also indicate about the risks of “overheating” and “full employment”. Note that inflation in the US reached 2, 1% and has already exceeded the Fed’s target level of 2%. Theoretically, such economic indicators can limit the potential of rate hike.
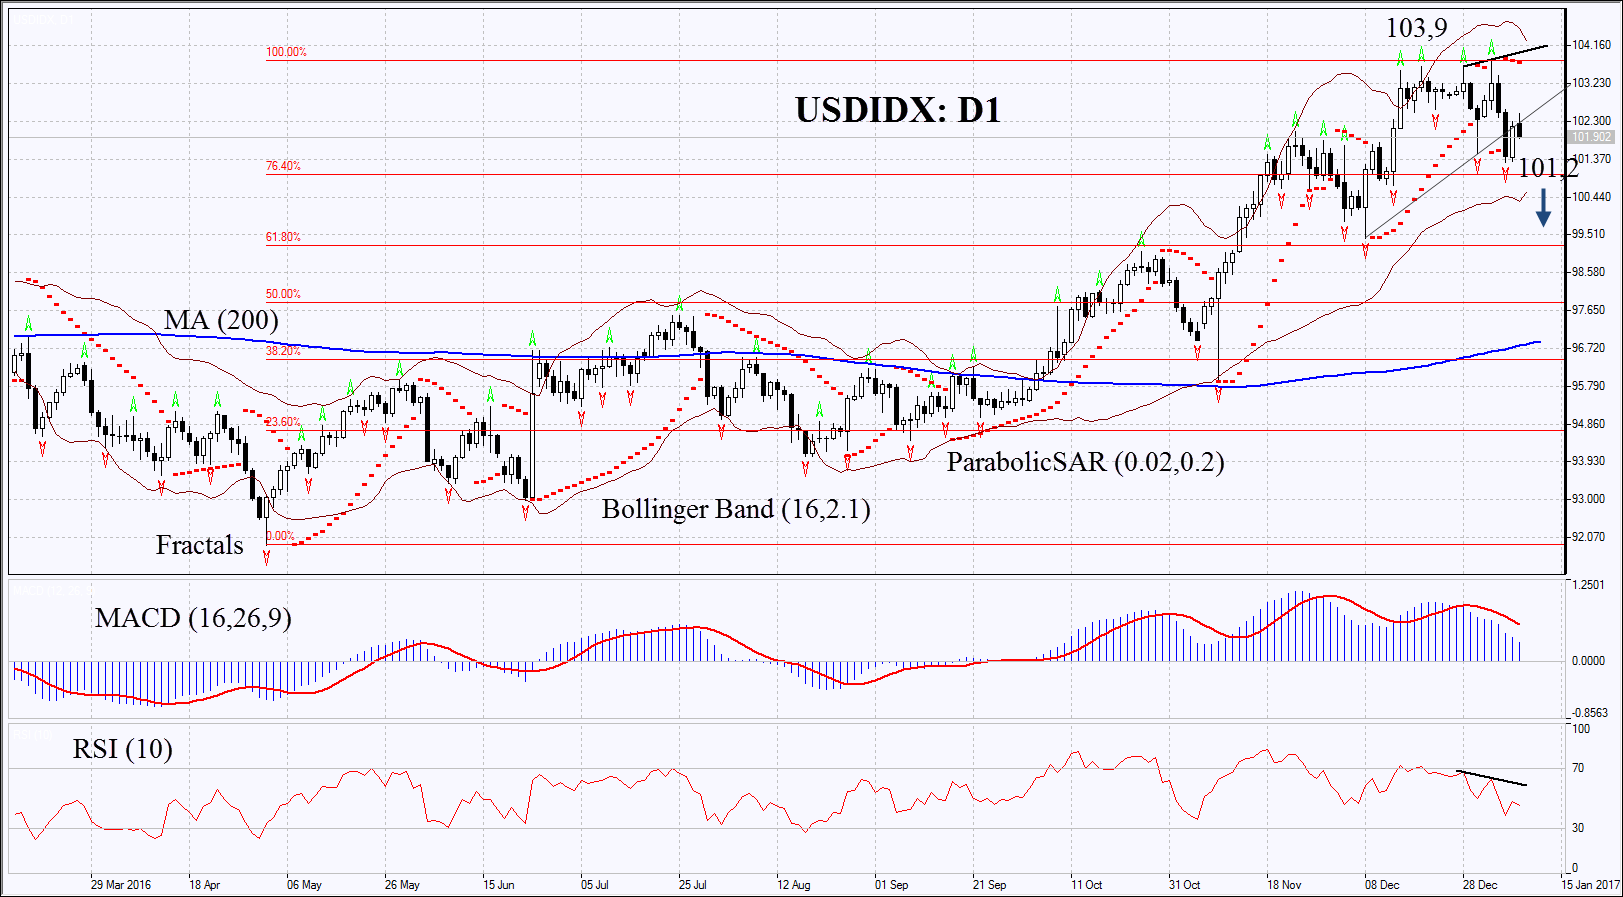
On the daily chart USDIDX: D1has ended the downtrend and is correcting down from its 14 – year high. Further decrease is possible in case of the publication of negative economic data in the US.
-
Parabolic indicatorgives a bearish signal.
-
Bollinger bands have widened which indicates high volatility.
-
RSI indicator is below 50. It has formed negative divergence.
-
MACD indicator gives a bearish signal.
The bearish momentum may develop in case USDIDX falls below the last fractal low at 101, 2. This level may serve as the point of entry. The initial stop-loss may be placed above the 14 – year high and the Parabolic signal at 103, 9. Psychological levels of 101 and 104 can also be used. After opening the pending order we shall move the stop to the next fractal high following the Parabolic and Bollinger signals. Thus, we are changing the probable profit/loss ratio to the breakeven point. The most risk-averse traders may switch to the 4-hour chart after the trade and place there a stop-loss moving it in the direction of the trade. If the price meets the stop-loss level at 103, 9 without reaching the order at 101, 2, we recommend cancelling the position: the market sustains internal changes which were not taken into account.
Summary of technical analysis
| Position | Sell |
| Sell stop | Below 101,2 |
| Stop loss | Above 103,9 |
Want to get more free analytics? Open Demo Account now to get daily news and analytical materials.
Author

Dmitry Lukashov
IFC Markets
Dimtry Lukashov is the senior analyst of IFC Markets. He started his professional career in the financial market as a trader interested in stocks and obligations.


