Technical analysis: S&P 500 index gaps lower as rally deflects off Ichimoku cloud

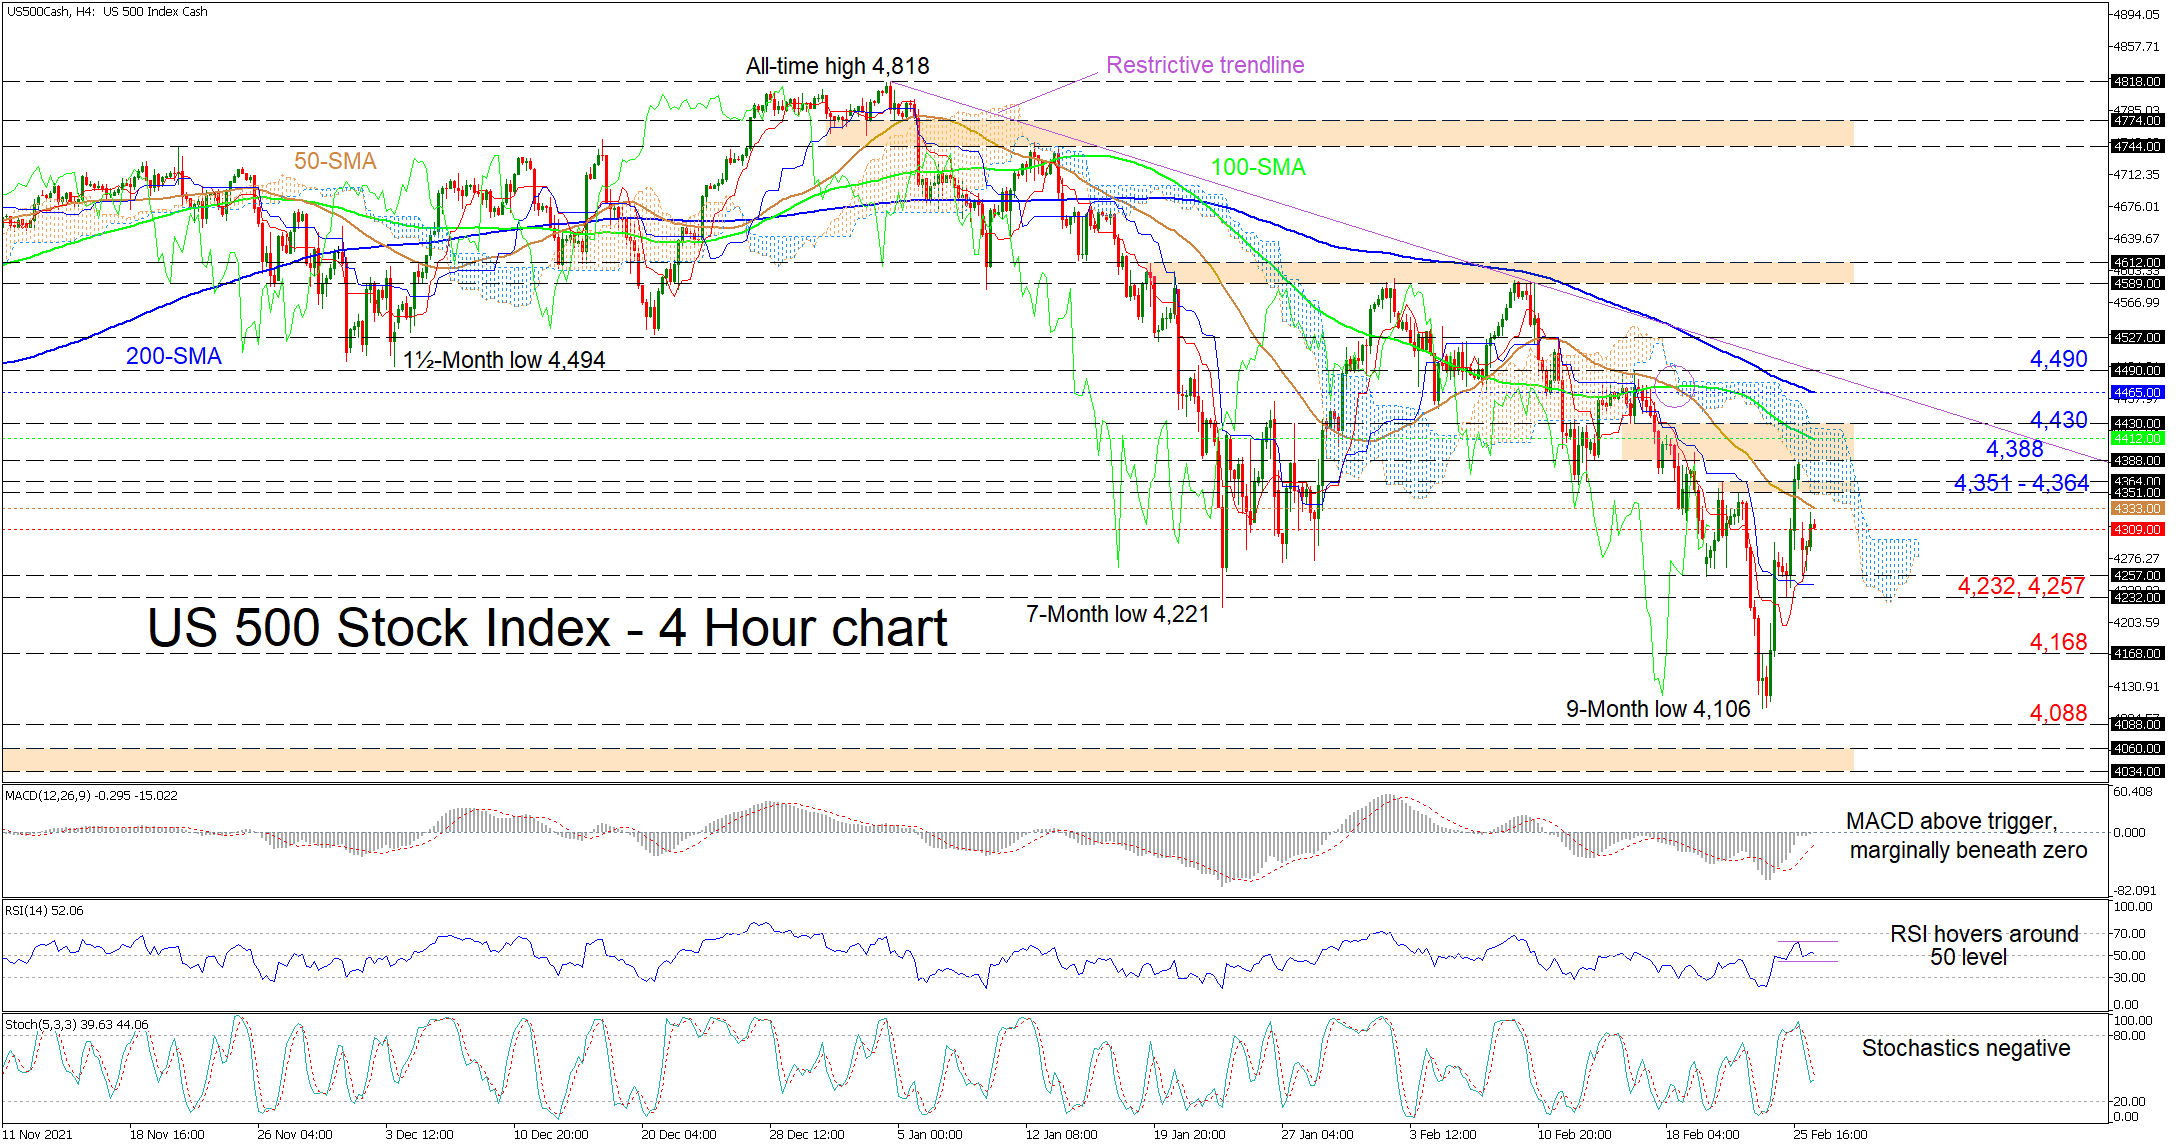
The US 500 stock index (Cash) has gapped back beneath its 50-period simple moving average (SMA), throwing some doubt into whether the bounce from the nine-month low of 4,106 could sustain optimism in the market. The Ichimoku cloud has taken the wind out of the index’s sails, and it appears that a swift overturn of the recent damage resulting from the Ukraine attacks, may likely take longer to offset. The falling SMAs continue to endorse the short-term bearish trend.
Meanwhile, the rising red Tenkan-sen line reflects the recent positive impetus however, the blue Kijun-sen line has yet to confirm the full abandonment of bearish forces. The short-term oscillators are conveying mixed messages in directional momentum. The MACD’s improvements above its red trigger line from deep in the bearish region, have stalled just beneath the zero threshold, implying sellers have resurfaced, while the RSI has flatlined around its 50 mark. The negatively charged stochastic oscillator is promoting the negative bearing.
In the positive scenario, upside limitations could commence from the descending 50-period SMA at 4,333 ahead of the adjacent 4,351-4,364 resistance barrier, fortified by the cloud’s lower band. If the index manages to regain its legs, a nearby resistance section from the 4,388 high until the 4,430 obstacle may prove to be more difficult to overcome. However, successfully overstepping this reinforced region, the bulls would still need to extend beyond the approaching 200-period SMA, currently at 4,465, and the 4,490 high, where a potential restrictive trend line, pulled from the all-time-high, also resides.
If selling pressures intensify, initial support could emanate between the 4,257 and 4,232 lows, which encapsulate the blue Kijun-sen line. Should the price dive below this zone, this may bring the 4,168 barrier into play before the bears target the nine-month low of 4,106. From here, if the price sinks past the 4,106 trough and the 4,088 low, identified in May 2021, the negative bias gains significant backing.
Summarizing, the US 500 index retains a bearish mood and the task to nullify recent weakness in the index now seems may take longer to accomplish. If the price persists beneath the SMAs, the cloud and the 4,388 high, credibility in the bearish bias may increase. That said, a climb above the SMAs and the 4,490 high may refuel optimism in the index.
Author

Anthony Charalambous joined XM in 2019 and specializes in preparing daily technical analysis, using his years of trading experience to provide detailed forecasting for all major asset classes such as forex, indices, commodities and equities.


