Disney competitive advantage supports a bullish view for its stock

Analysts point to conservative Disney estimates of subscriptions as the company prepares to launch new services in fall. Will the Disney stock price continue rebounding?
Disney reported $1.61 earnings per share on revenue of $14.92 billion in its fiscal second quarter ended March 30. Both earnings and revenue beat expectations forecast at $1.57 per share on revenue of $14.53 billion. The outperformance was accredited to revenue from its Parks, Experiences and Products segment which rose 5% to $6.2 billion. Morgan Stanley upgraded the stock to buy a week ago, raising their price target on the stock to $160 from $135. Investors are potentially underestimating just how quickly Disney could become a major player in the streaming market, analysts say. Disney is planning to launch its over-the-top streaming service Disney+ on November 12. It has set subscription price at $6.99 per month, while Netflix 's least expensive plan is $8.99 per month. Morgan Stanley estimates Disney will attract at least 130 million total subscribers by 2024, while Disney forecast total streaming subscribers of 135 million by 2024 at the midpoint of its guidance. Disney competitive advantage over rivals supports a bullish view for its stock.
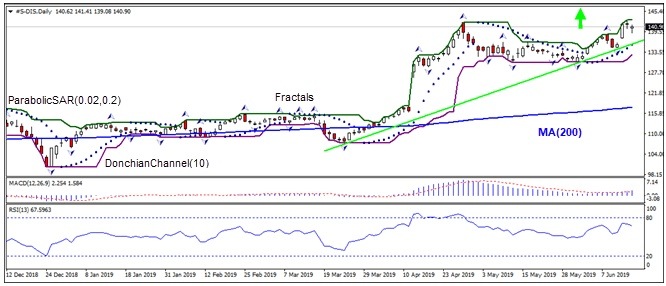
On the daily timeframe the S-DIS: D1 is rising above the support line. It is above the 200-day moving average MA(200) which is also rising. This is bullish.
-
The Parabolic indicator gives a buy signal.
-
The Donchian channel indicates uptrend: it is tilted up.
-
The MACD indicator gives a bullish signal: it is above the signal line and the gap is widening.
-
The RSI oscillator is falling but has not reached the oversold zone yet.
We believe the bullish momentum will continue after the price breaches above the upper boundary of Donchian channel at 142.88. This level can be used as an entry point for placing a pending order to buy. The stop loss can be placed below the fractal low at 133.12. After placing the order, the stop loss is to be moved every day to the next fractal low, following Parabolic signals. Thus, we are changing the expected profit/loss ratio to the breakeven point. If the price meets the stop loss level (133.12) without reaching the order (142.88), we recommend cancelling the order: the market has undergone internal changes which were not taken into account.
Technical Analysis Summary
|
Order |
Buy |
|
Buy stop |
Above 142.88 |
|
Stop loss |
Below 133.12 |
Want to get more free analytics? Open Demo Account now to get daily news and analytical materials.
Want to get more free analytics? Open Demo Account now to get daily news and analytical materials.
Author

Dmitry Lukashov
IFC Markets
Dimtry Lukashov is the senior analyst of IFC Markets. He started his professional career in the financial market as a trader interested in stocks and obligations.


