Technical Analysis – NZDUSD in consolidation mode; Bearish crossover recorded recently

NZDUSD has been mostly moving within a narrow range over the last five trading days (between 0.6950 and 0.7050). This neutral tone is also projected by the RSI indicator which is currently at 50 and has remained in this 50 area throughout this period of consolidation.
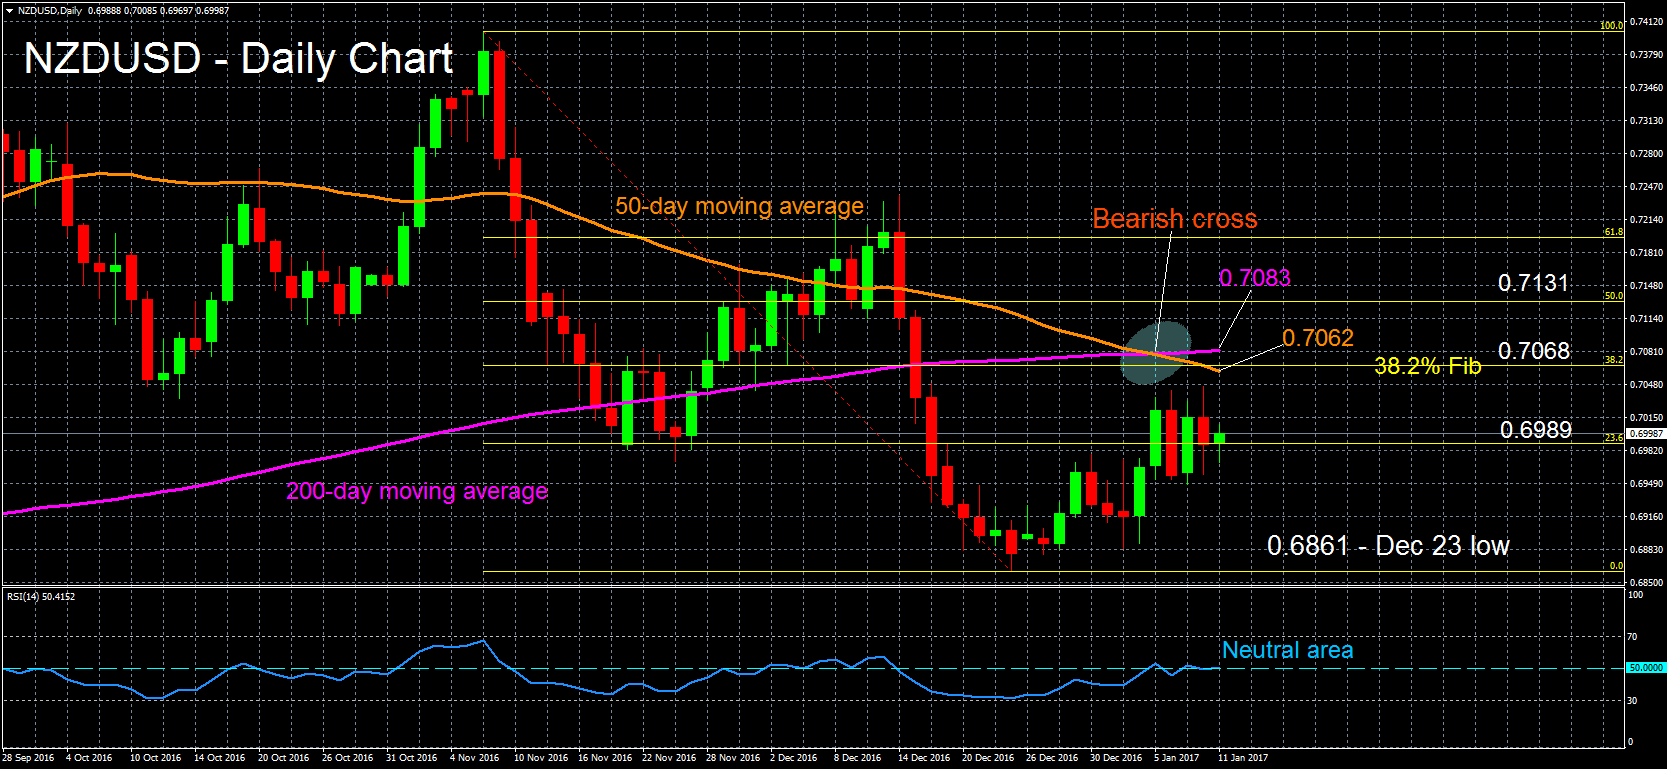
However, the bearish cross recently recorded with the 50-day moving average (MA) crossing below the 200-day one could indicate that we’re about to enter a period of downward movement for the pair.
On the upside, the 50-day MA at 0.7062 and the 38.2% Fibonacci retracement mark at 0.7068 (of the November 8 – December 23 downleg) are expected to act as an immediate resistance area. The next key resistance level is the 200-day MA at 0.7083.
On the downside, the 23.6% Fibonacci retracement at 0.6989 will likely act as a support level. This is in close proximity to the price at the time of writing (at 0.6999) and a successful daily close below this point will bring into scope the December 23 6 ½-month low of 0.6861.
Author

Manned by a powerful team of professionals, along with certified forex instructors, the XM Research and Education Center provides a full range of up-to-date marketing tools essential for profitable trading, including market analys


