Technical Analysis NIKKEI: 2019-02-18
There is a progress in US-China negotiations
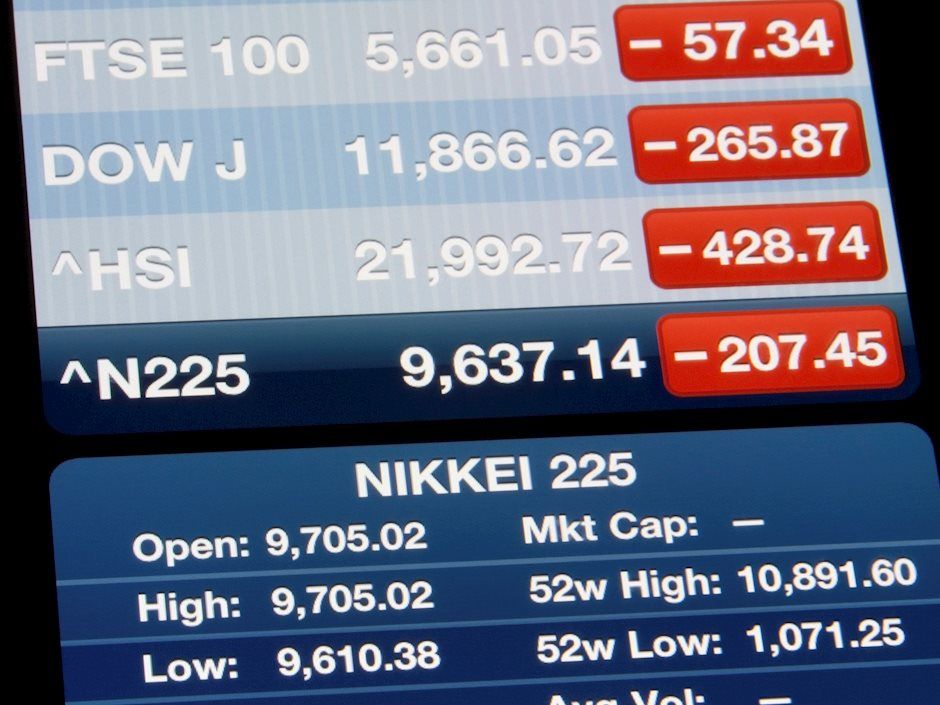
Progress in US - China trade negotiations provoked an increase in global stock indices. Quotations for Nikkei will increase or not?
Chinese President Xi Jinping said that the US-China trade negotiations will continue this week. He expressed the hope that the parties would come to a mutually beneficial agreement. A possible weakening of the yen, against the background of risk reduction, may help improve the financial performance of Japanese exporters. In the midst of global trade wars, the yen was in demand by investors as a safe-haven currency. An additional positive for the Nikkei could be Japan’s GDP growth in the 4th quarter of 2018 by 1.4% in annual terms, after the economic downturn in the 3rd quarter. As a result, Japanese GDP for the last year grew by 0.7%. The increase has been observed for the 7th year in a row.
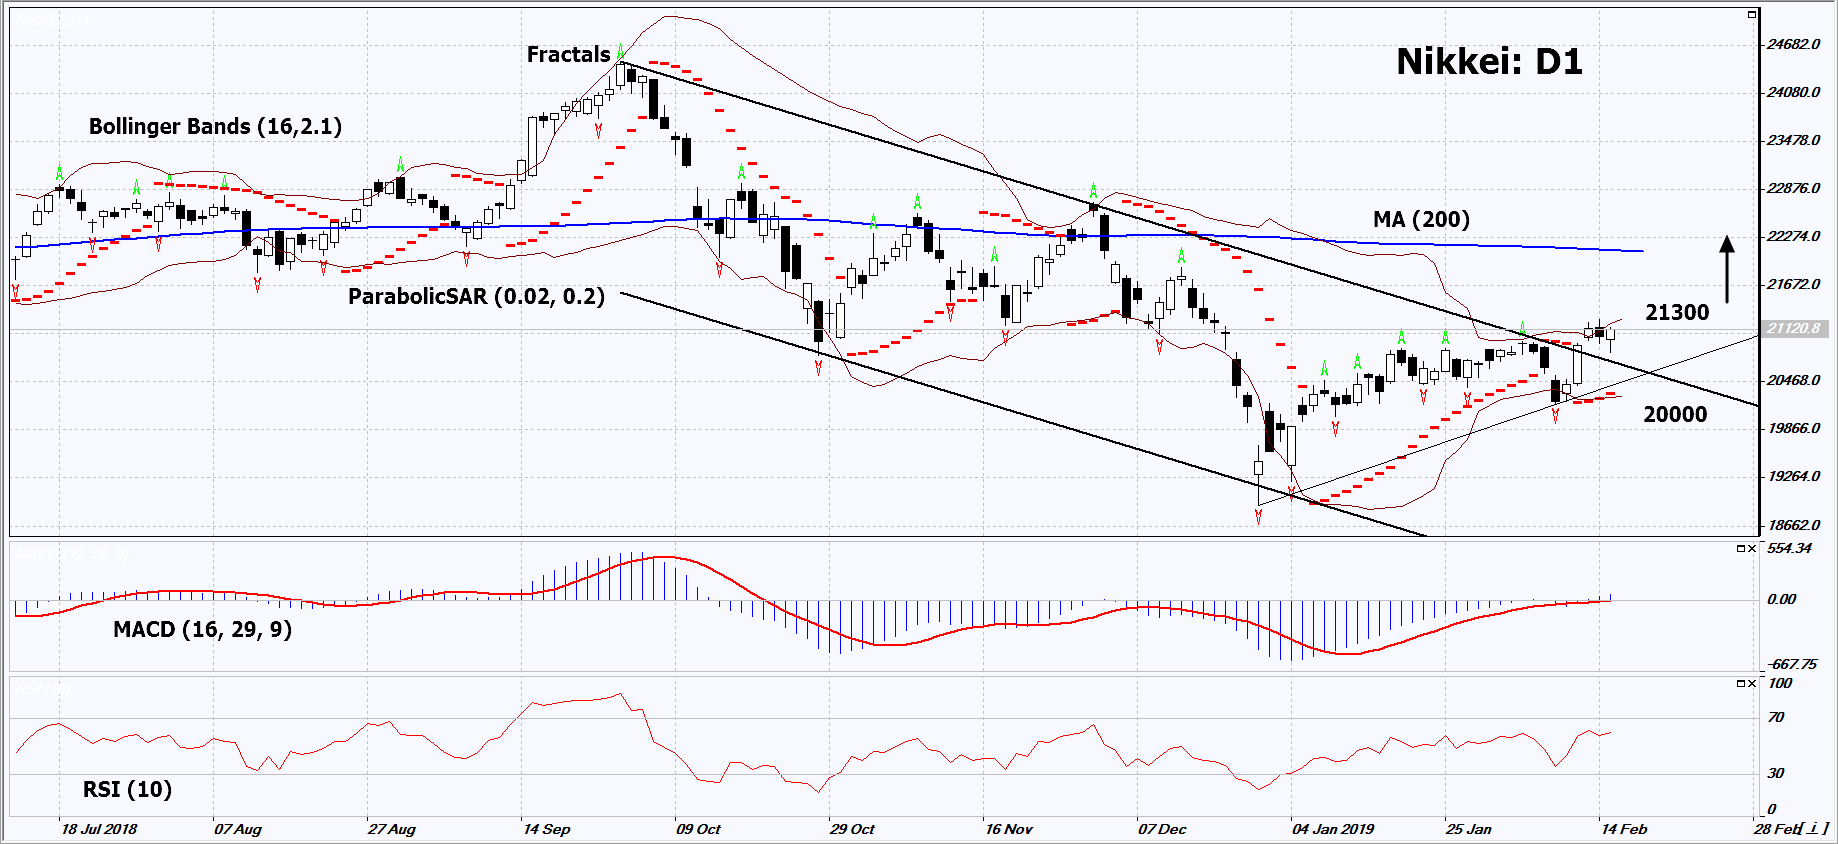
On the daily timeframe, Nikkei: D1 broke up the resistance line of the descending channel. A number of technical analysis indicators formed buy signals. The further price growth is possible in case of positive macroeconomic and corporate news.
-
The Parabolic Indicator gives a bullish signal.
-
The Bollinger bands have narrowed, which indicates a volatility decrease. Both Bollinger bands are titled upwards.
-
The RSI indicator is above 50. No divergence.
-
The MACD indicator gives a bullish signal.
The bullish momentum may develop in case Nikkei exceeds its last fractal high and the upper Bollinger band at 21300. This level may serve as an entry point. The initial stop loss may be placed below the last lower fractal, the lower Bollinger line and the Parabolic sline: 20000. After opening the pending order, we shall move the stop to the next fractal low following the Bollinger and Parabolic signals. Thus, we are changing the potential profit/loss to the breakeven point. More risk-averse traders may switch to the 4-hour chart after the trade and place there a stop loss moving it in the direction of the trade. If the price meets the stop level (21300), without reaching the order (20000), we recommend to close the position: the market sustains internal changes that were not taken into account.
Summary of technical analysis
|
Position |
Buy |
|
Buy stop |
Above 21300 |
|
Stop loss |
Below 20000 |
Want to get more free analytics? Open Demo Account now to get daily news and analytical materials.
Want to get more free analytics? Open Demo Account now to get daily news and analytical materials.
Author

Dmitry Lukashov
IFC Markets
Dimtry Lukashov is the senior analyst of IFC Markets. He started his professional career in the financial market as a trader interested in stocks and obligations.


