|

Technical Analysis – GBPUSD bullish; eyes 10-month high

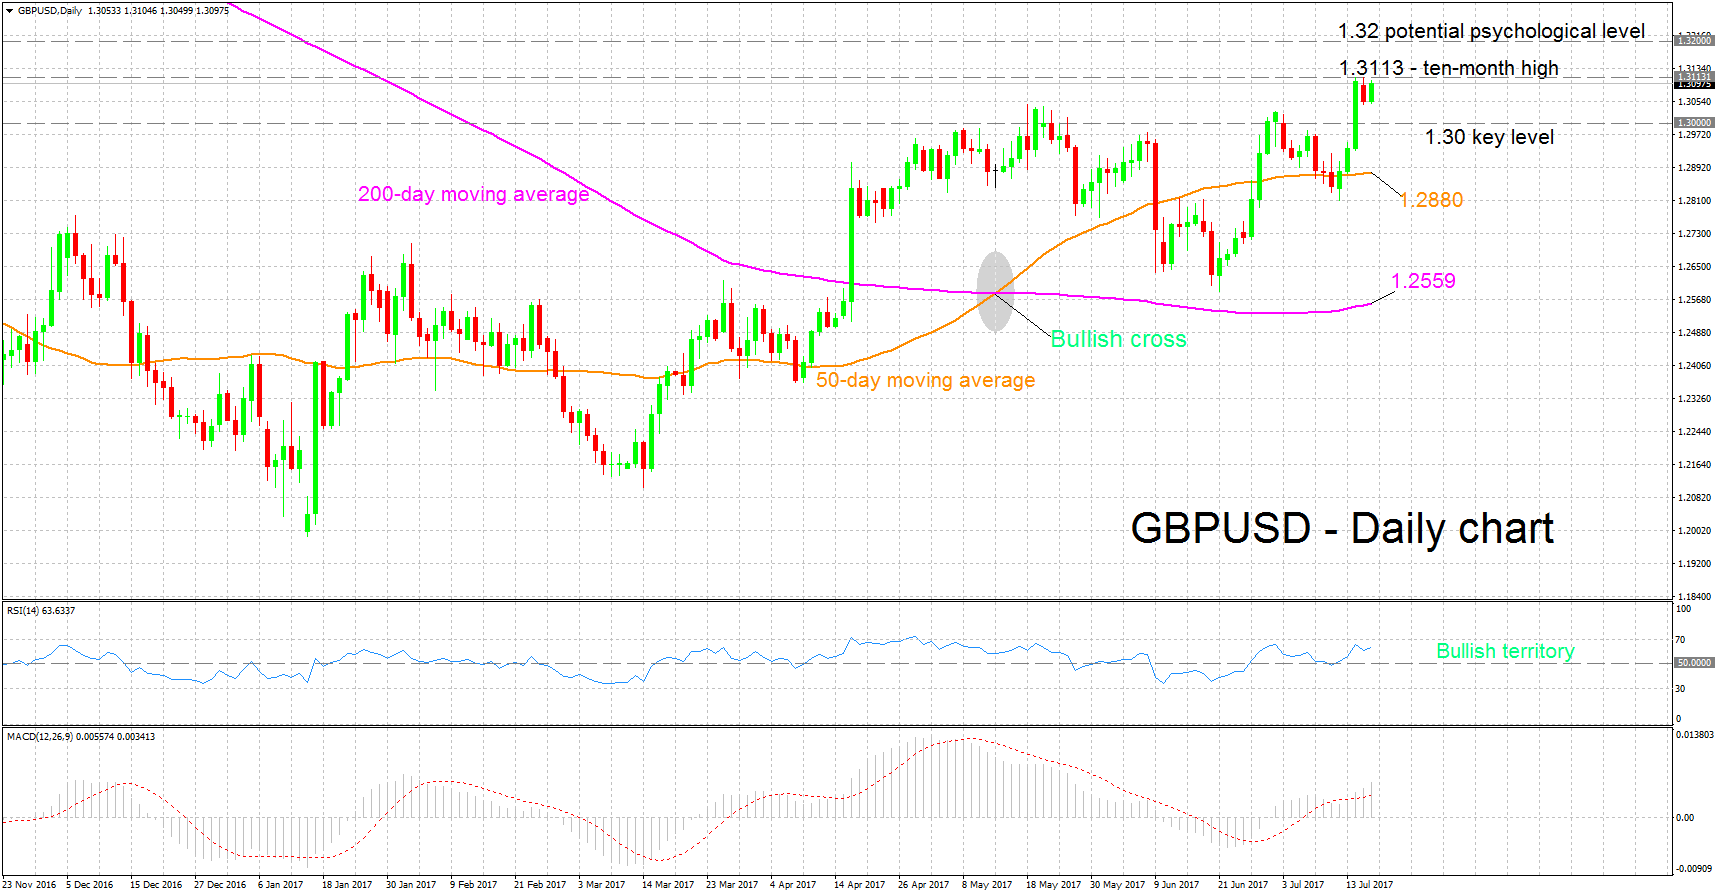
GBPUSD closed higher in the preceding three out of four trading days. During Friday’s trading, it advanced by a hefty 1.3%, reaching a ten-month high of 1.3113 along the way.

Technical indicators including the MACD and RSI are painting a bullish picture for the pair. In particular, the MACD is positive as well as above the red signal line. The RSI indicator is in bullish territory at 64 and keeps heading higher, indicating the existence of positive momentum in the near-term.

Should the price edge higher, the area around Friday’s high of 1.3113 could pose a barrier to further advances. Notice that the price is currently close to this level. A successful break above would divert attention to the area around 1.32, a potential psychological mark that might act as resistance.

If the price declines, the area around the 1.30 handle, which was of significance in the recent past, could provide support. Should it be violated, the area around the current level of the 50-day moving average (MA) at 1.2880 would be eyed next.

Regarding the medium-term picture, the pair has been in an overall uptrend since the start of the year. This supports the positive medium-term signal given by the bullish cross that was formed during May when the 50-day MA moved above the 200-day one. Additional supportive evidence for the bullish outlook comes from the price recently crossing above both the 50- and 200-day MAs.

GBPUSD

Author

XM Research Department

Manned by a powerful team of professionals, along with certified forex instructors, the XM Research and Education Center provides a full range of up-to-date marketing tools essential for profitable trading, including market analys

More from XM Research Department
Share:

Editor's Picks

EUR/USD treads water around 1.1900

EUR/USD edges a tad lower around the 1.1900 area, coming under mild pressure despite the US Dollar keeps the offered stance on turnaround Tuesday. On the US data front, December Retail Sales fell short of expectations, while the ADP four week average printed at 6.5K.

GBP/USD looks weak near 1.3670

GBP/USD trades on the back foot around the 1.3670 region on Tuesday. Cable’s modest retracement also comes in tandem with the decent decline in the Greenback. Moving forward, the US NFP and CPI data in combination with key UK releases should kee the quid under scrutiny in the next few days.

Gold the battle of wills continues with bulls not ready to give up

Gold comes under marked selling pressure on Tuesday, giving back part of its recent two day advance and threatening to challenge the key $5,000 mark per troy ounce. The yellow metal’s correction follows a better tone in the risk complex, a lower Greenback and shrinking US Treasuty yields.

AI Crypto Update: BankrCoin, Pippin surge as sector market cap steadies above $12B

The Artificial Intelligence (AI) segment is largely on the back foot with major coins such as Bittensor (TAO) and Internet Computer (ICP) extending losses amid a sticky risk-off sentiment.

Dollar drops and stocks rally: The week of reckoning for US economic data

Following a sizeable move lower in US technology Stocks last week, we have witnessed a meaningful recovery unfold. The USD Index is in a concerning position; the monthly price continues to hold the south channel support.

XRP holds $1.40 amid ETF inflows and stable derivatives market

Ripple trades under pressure, with immediate support at $1.40 holding at the time of writing on Tuesday. A recovery attempt from last week’s sell-off to $1.12 stalled at $1.54 on Friday, leading to limited price action between the current support and the resistance.