Technical analysis: Will the GBP/USD retreat reverse?

Recommendation for GBP/USD: Sell
Sell Stop: Below 1.3765.
Stop Loss: Above 1.3828.
RSI: Neutral.
MACD: Sell.
Donchian Channel: Neutral.
MA(200): Buy.
Fractals: Sell.
Parabolic SAR: Sell.
Chart analysis
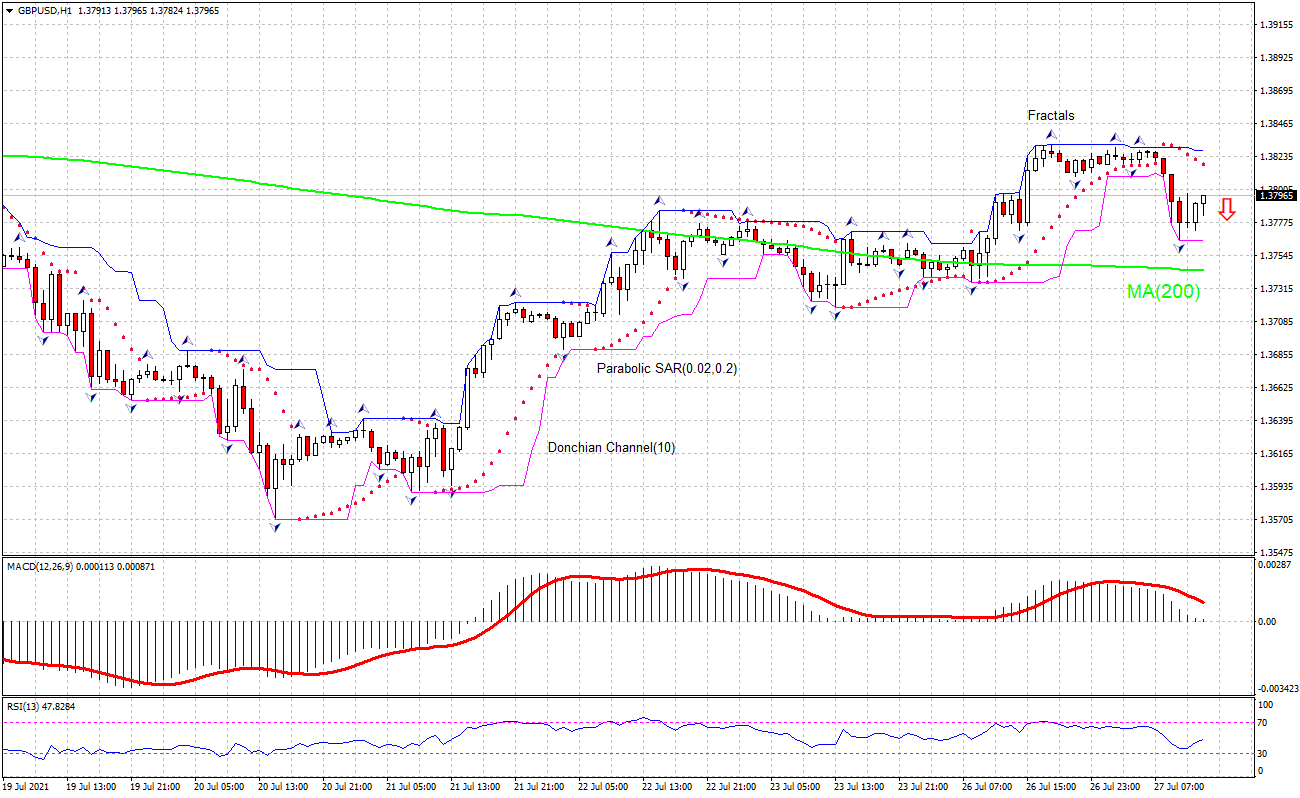
The GBPUSD technical analysis of the price chart on a 1-hour timeframe shows GBPUSD: H1 is retracing above the 200-period moving average MA(200) which is falling itself. We believe the bearish movement will continue after the price breaches below the lower bound of the Donchian channel at 1.3765. A level below this can be used as an entry point for placing a pending order to sell. The stop loss can be placed above 1.3828. After placing the order, the stop loss is to be moved to the next fractal high indicator, following Parabolic signals. Thus, we are changing the expected profit/loss ratio to the breakeven point. If the price meets the stop loss level without reaching the order, we recommend cancelling the order: the market has undergone internal changes which were not taken into account.
Fundamental analysis
UK’s Confederation of British Industry survey results was better than expected. Will the GBPUSD retreat reverse? UK’s Confederation of British Industry survey results was better than expected: the CBI Distributive Trades Survey showed retail sales grew in the year to July at a similar pace as last month: +23% after +25% in June when a slower growth at 21% was forecast. This is bullish for GBPUSD. However current technical setup is bearish for GBPUSD.
Want to get more free analytics? Open Demo Account now to get daily news and analytical materials.
Want to get more free analytics? Open Demo Account now to get daily news and analytical materials.
Author

Dmitry Lukashov
IFC Markets
Dimtry Lukashov is the senior analyst of IFC Markets. He started his professional career in the financial market as a trader interested in stocks and obligations.


