Technical Analysis GBPUSD : 2016-11-24
Awaiting Friday data
Durable goods orders rose in US in October above expectations, the data came out on Wednesday. This pushed US currency up. Let’s consider GBPUSD pair. Will pound sterling continue weakening?
Besides stronger dollar, GBPUSD may decline under internal factors in UK, and Brexit is the main. To soften its negative influence the monetary stimulus for the British economy will be introduced. The Bank of England may cut further its interest rate which is being 0.25%, and buy-back corporate and banking debt following suit of QE by Fed and ECB. Mild monetary policy pushes currency rate lower. Autumn budget statement came out in UK on Wednesday. GDP is expected to rise 2.1% in 2016 and 1.4% in 2017. On the contrary, inflation is to rise 0.7% this year and 2.3% next year. In spring budget statement inflation for 2017 was expected to be 1.6%. We believe all these data look negative. On Friday November 25 the important economic data will come out in Great Britain: GDP, trade balance and fixed capital formation for Q3 2016. The tentative outlook is neutral as no changes are expected compared to Q2.
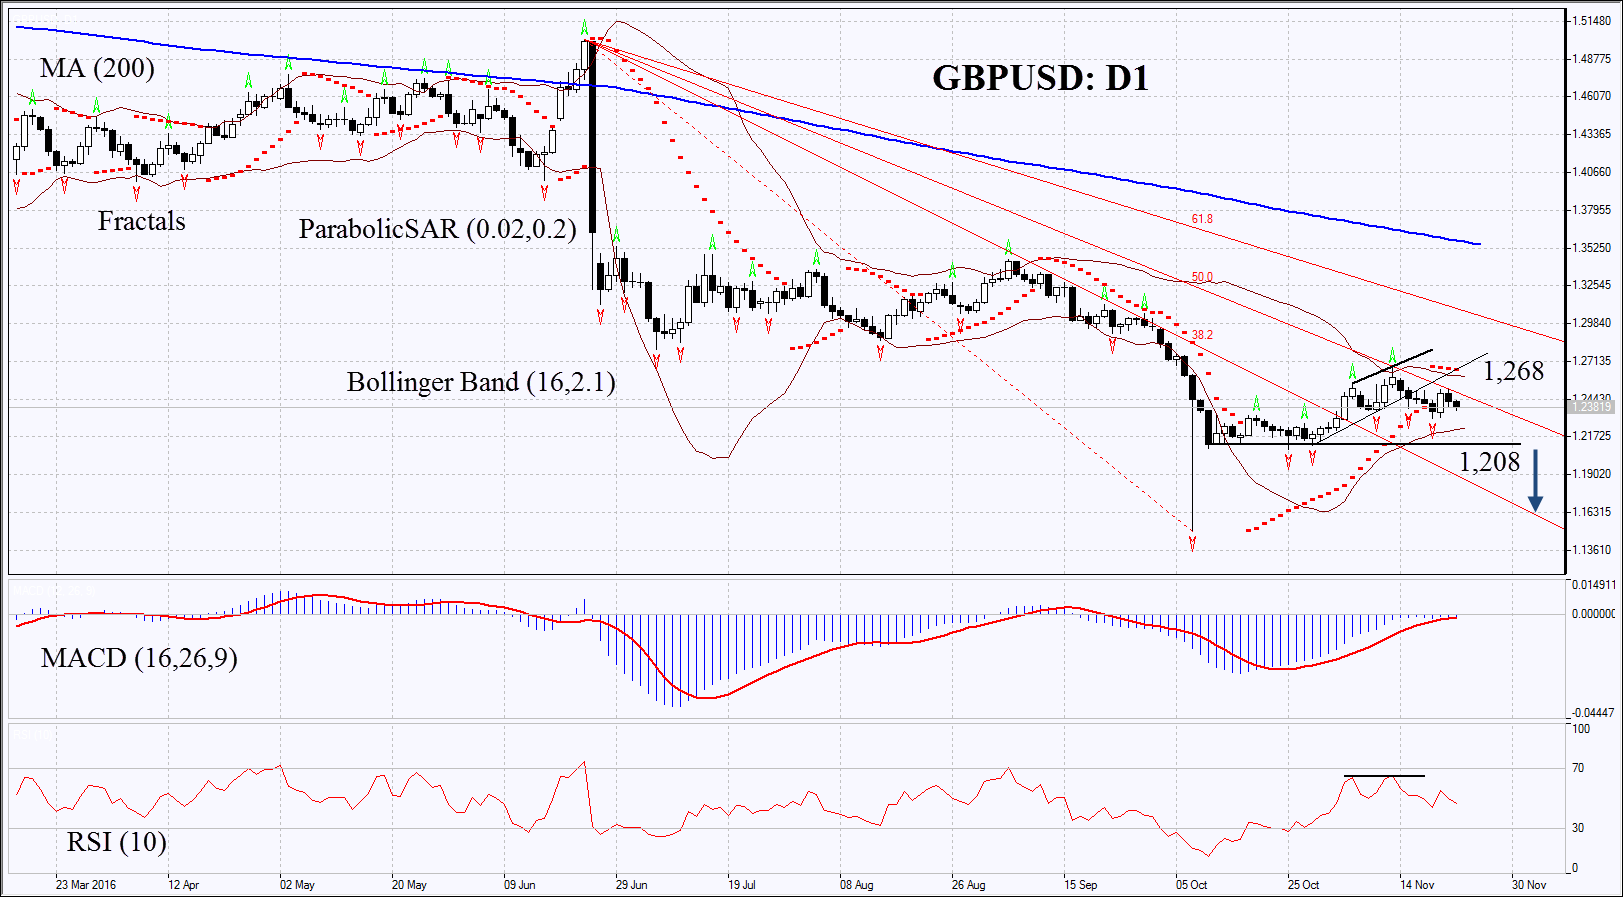
On the daily chart GBPUSD: D1 has corrected up after the slump. It has reached the 2nd Gann resistance line but failed to break through it and is falling again. Further decline is possible in case UK economic indicators worsen and on negative influence of Brexit.
-
Parabolic gives bearish signal.
-
Bollinger bands have narrowed a lot which means lower volatility.
-
RSI has fallen below 50. It has formed negative divergence.
-
MACD gives bearish signals, but has extremely low amplitude.
The bearish momentum may develop in case the British pound British pound falls below the support of the sideways trend, last fractal low and Bollinger band at 1.208. This level may serve the point of entry. The initial stop-loss may be placed above the Parabolic signal and the upper Bollinger band at 1.268. Having opened the pending order we shall move the stop to the next fractal high following the Parabolic and Bollinger signals. Thus, we are changing the probable profit/loss ratio to the breakeven point. The most risk-averse traders may switch to the 4-hour chart after the trade and place there a stop-loss moving it in the direction of the trade. If the price meets the stop-loss level at 1.268 without reaching the order at 1.208, we recommend cancelling the position: the market sustains internal changes which were not taken into account.
Summary of technical analysis
|
Position |
Sell |
|
Sell stop |
below 1.208 |
|
Stop loss |
above 1.268 |
Want to get more free analytics? Open Demo Account now to get daily news and analytical materials.
Author

Dmitry Lukashov
IFC Markets
Dimtry Lukashov is the senior analyst of IFC Markets. He started his professional career in the financial market as a trader interested in stocks and obligations.


