Technical Analysis GBPCHF: 2019-01-15
The Swish National Bank reduced the volume of reserves
In this review, we suggest considering another currency pair with the British pound. Is there a possibility for the GBPCHF to rise?
Such dynamics indicate the strengthening of the British pound and the weakening of the Swiss franc. The British currency is rising before the parliamentary vote on the terms of Brexit, which is expected to be held on Tuesday, January 15. Let us recall that the UK’s withdrawal from the European Union is scheduled to take place on March 29, 2019. A referendum on this issue took place in summer of 2016, which became the reason for the significant weakening of the pound. On January 16, data on inflation for December, which may also affect the dynamics of the exchange rate will be published in the UK. A negative factor for the Swiss franc was the reduction of reserves of the Swish National Bank in December 2018 by 2.7% compared to November. As a result, reserves fell to the low since September 2017 and amounted to 729 billion Swiss francs. In addition, the Swiss National Bank reported a loss in 2018 in the amount of 15 billion Swiss francs.
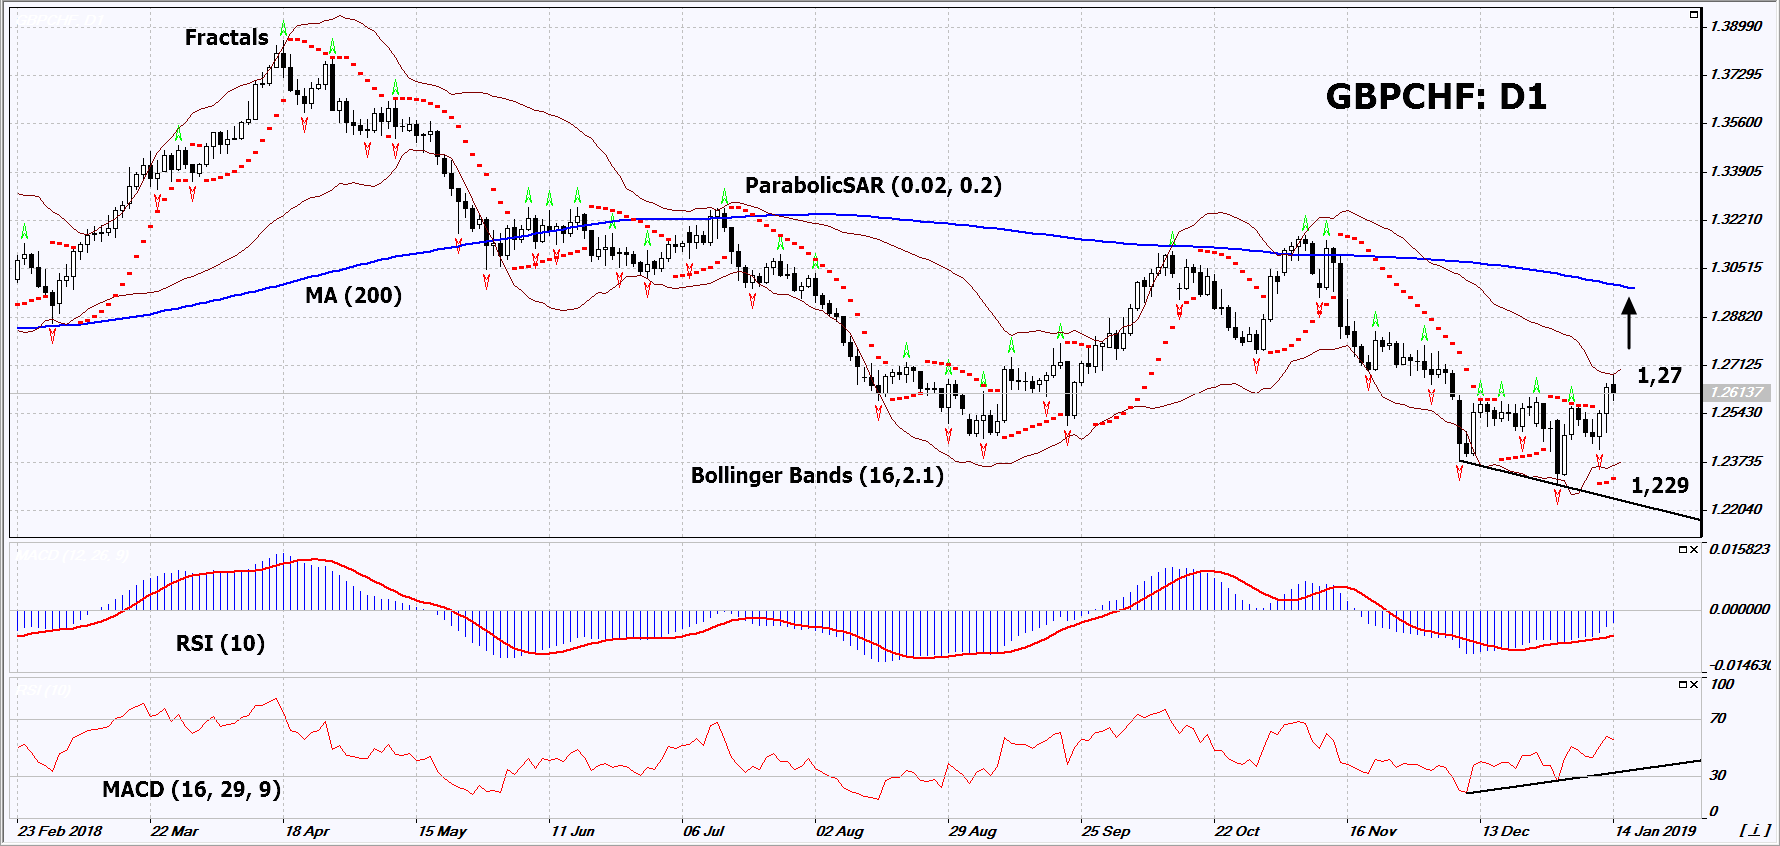
On the daily timeframe, GBPCHF: D1 has moved from the downtrend to the neutral and is trying to correct up. A number of technical analysis indicators formed buy signals. The further price increase is possible in case of the transfer of Brexit and publication of positive macroeconomic indicators in the UK.
-
The Parabolic indicator gives a bullish signal.
-
The Bollinger bands have narrowed, which indicates low volatility. Both Bollinger bands are titled upward.
-
The RSI indicator is above 50. It has formed a positive divergence.
-
The MACD indicator gives a bullish signal.
The bullish momentum may develop in case GBPCHF exceeds the upper Bollinger band and its last high at 1.23. This level may serve as an entry point. The initial stop loss may be placed below the two last fractal lows, the low since August 2017, the lower Bollinger band and the Parabolic signal at 1.229. After opening the pending order, we shall move the stop to the next fractal low following the Bollinger and Parabolic signals. Thus, we are changing the potential profit/loss to the breakeven point. More risk-averse traders may switch to the 4-hour chart after the trade and place there a stop loss moving it in the direction of the trade. If the price meets the stop level (1.229) without reaching the order (1.27), we recommend to close the position: the market sustains internal changes that were not taken into account.
Summary of technical analysis
|
Position |
Buy |
|
Buy stop |
Above 1.27 |
|
Stop loss |
Below 1.229 |
Want to get more free analytics? Open Demo Account now to get daily news and analytical materials.
Want to get more free analytics? Open Demo Account now to get daily news and analytical materials.
Author

Dmitry Lukashov
IFC Markets
Dimtry Lukashov is the senior analyst of IFC Markets. He started his professional career in the financial market as a trader interested in stocks and obligations.


