Getting ready for the ECB meeting next week

In this review, we suggest to consider a personal composite instrument (PCI) & EUR_Index. It reflects the dynamics of changes in the value of the euro relative to other world currencies.Will the EUR_Index quotations grow?
The growth of this PCI indicates the strengthening of the single European currency. The main factor for this could be a stable positive trade balance of the Eurozone, amounting to about 20 billion euros per month. The positive trend can continue. According to the Center for European Economic Research (ZEW), business activity in Germany increased significantly in October. Next week, on October 24, the next meeting of the ECB will be held. Accordingly, this week, a number of representatives of the European regulator are expected to speak, which may affect the dynamics of the euro.
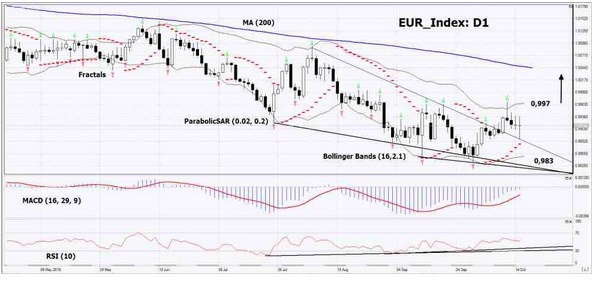
On the daily timeframe EUR_Index: D1 moved into a short-term neutral trend. Various technical analysis indicators have generated signals to increase. Further growth of quotations is possible if positive macroeconomic indicators are published in the EU and the current ECB policy is maintained.
The Parabolic indicator gives a bullish signal.
The Bolinger bands widened, indicating high volatility. Both Bollinger Lines Slope Up .
The RSI indicator is above the 50 mark. It has formed a divergence to increase.
The MACD indicator shows a signal to increase.
The bullish momentum may develop if EUR_Index exceeds its last upper fractal and the upper Bollinger line: 0.997. This level can be used as an entry point. Initial stop lose may be placed below the last lower fractal, the lower Bollinger line and the Parabolic signal: 0.983. After opening the pending order, the stop shall be moved following the Bollinger and Parabolic signals to the next fractal minimum. Thus, we are changing the potential profit/loss to the breakeven point. More risk-averse traders may switch to the 4-hour chart after the trade and place a stop loss moving it in the direction of the trade. If the price meets the stop level (0,983) without reaching the order (0,997), we recommend to cancel the order: the market sustains internal changes that were not taken into account.
Technical Analysis Summary
Position: Buy
Buy stop: Above 0,997
Stop loss: Below 0,983
Want to get more free analytics? Open Demo Account now to get daily news and analytical materials.
Want to get more free analytics? Open Demo Account now to get daily news and analytical materials.
Author

Dmitry Lukashov
IFC Markets
Dimtry Lukashov is the senior analyst of IFC Markets. He started his professional career in the financial market as a trader interested in stocks and obligations.


