Expectations of higher crop and exports bearish for sugar price

Brazil’s sugar output is expected to rise in September while India subsidizes its exports. Will the sugar prices continue declining?
Sugar global price is depressed due to ample global supply. India’s government established export subsidy in the end of August to support sugar mills in shipping 6 million tons of sugar in 2019/20 October-September season. India is the fourth largest sugar exporter in the world. And Indian sugar mills are aggressively selling 2018/19 old crop sugar to Iran: they reached agreement to export 350,000 tons of sugar to Iran a week ago. A couple weeks ago S&P Global Platts analysts survey projected the sugarcane crush in the key Center-South Brazil region is expected to total 36.44 million tons in the second half of September, an increase of 30.9% year on year. And the proportion of cane used for sugar production is expected to be 34.44%, up from 33.02% a year earlier. Brazil is top sugar exporter in the world. Expectations of ample global supply are bearish for sugar prices.
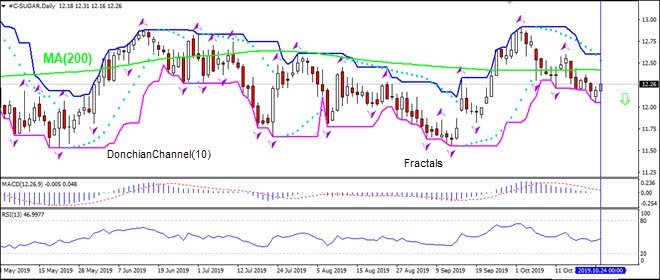
On the daily timeframe the SUGAR: D1 is below the 200-day moving average MA(200) which is falling, this is bearish.
-
The Parabolic indicator gives a sell signal.
-
The Donchian channel indicates no trend: it is flat.
-
The MACD indicator gives a bearish signal: it is below the signal line and the gap is widening.
-
The RSI oscillator is rising but has not reached the overbought zone.
We believe the bearish momentum will continue after the price breaches below the lower boundary of Donchian channel at 12.05. This level can be used as an entry point for placing a pending order to sell. The stop loss can be placed above the last fractal high at 12.60. After placing the order, the stop loss is to be moved every day to the next fractal high, following Parabolic signals. Thus, we are changing the expected profit/loss ratio to the breakeven point. If the price meets the stop loss level (12.60) without reaching the order (12.05), we recommend cancelling the order: the market has undergone internal changes which were not taken into account.
Technical Analysis Summary
| Order | Sell |
| Sell stop | Below 12.05 |
| Stop loss | Above 12.60 |
Want to get more free analytics? Open Demo Account now to get daily news and analytical materials.
Want to get more free analytics? Open Demo Account now to get daily news and analytical materials.
Author

Dmitry Lukashov
IFC Markets
Dimtry Lukashov is the senior analyst of IFC Markets. He started his professional career in the financial market as a trader interested in stocks and obligations.
















