Daily Technical Analysis: #C-SUGAR

Weather deterioration in India may increase sugar prices
The S&P Global Platts agency expects global sugar shortage in the 2019/20 agricultural season in the amount of 1.93 million tons. The season starts in October. Will sugar prices rise?
Let us note that according to this agency, based on the results of the 2018/19 season, a global sugar surplus in the amount of 5.55 million tons will be formed due to an increase in its production in India, Guatemala, El Salvador and Belize. Note that India is the world's largest sugar producer. It beat Brazil in the previous season. According to the India Meteorological Department, negative weather conditions for agriculture may be formed in India in the current year because of the Indian Ocean Dipole and El Nino natural phenomena. If this happens, then, the global sugar surplus may be less than the forecast of the S&P Global Platts. An additional factor for the possible price increase may be the sugar beet crop reduction in Ukraine by 5% to 261 thousand hectares according to forecasts of the Ministry of Agrarian Policy and Food of Ukraine or even to 230 thousand hectares according to forecasts of the independent producer association Ukrtsukor. Let us note that a number of independent agencies expect a significant reduction in sugar exports from EU countries.
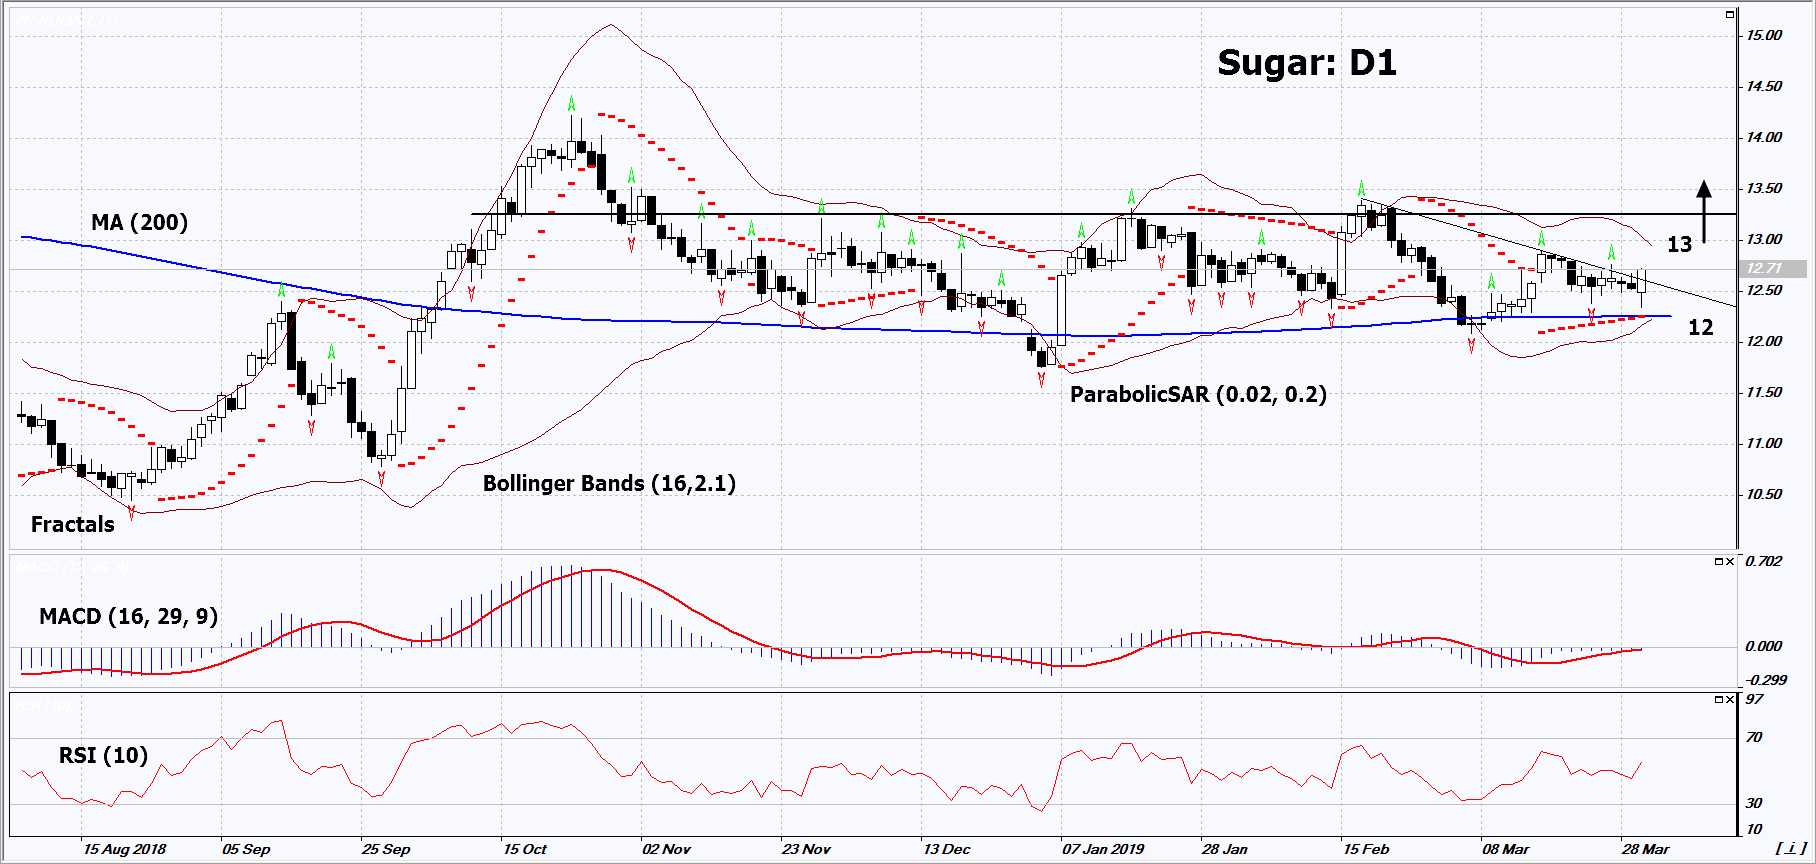
On the daily timeframe, Sugar: D1 has been in a neutral trend since October of the last year and the lower boundary of the neutral trend is the 200-day moving average line. Now prices are edging up from there. A number of technical analysis indicators formed buy signals. The further price increase is possible in case of a reduction in global harvest.
-
The Parabolic Indicator gives a bullish signal.
-
The Bollinger bands have narrowed, which indicates low volatility. The lower Bollinger band is titled upward.
-
The RSI indicator is above 50. No divergence.
-
The MACD indicator gives a bullish signal.
The bullish momentum may develop in case Sugar exceeds its two last fractal highs and the upper Bollinger band at 13. This level may serve as an entry point. The initial stop loss may be placed below the two last fractal lows, the lower Bollinger band, the 200-day moving average line and the Parabolic signal at 12. After opening the pending order, we shall move the stop to the next fractal low following the Bollinger and Parabolic signals. Thus, we are changing the potential profit/loss to the breakeven point. More risk-averse traders may switch to the 4-hour chart after the trade and place there a stop loss moving it in the direction of the trade. If the price meets the stop level (12) without reaching the order (13), we recommend to close the position: the market sustains internal changes that were not taken into account.
Summary of technical analysis
|
Position |
Buy |
|
Buy stop |
Above 13 |
|
Stop loss |
Below 12 |
Want to get more free analytics? Open Demo Account now to get daily news and analytical materials.
Want to get more free analytics? Open Demo Account now to get daily news and analytical materials.
Author

Dmitry Lukashov
IFC Markets
Dimtry Lukashov is the senior analyst of IFC Markets. He started his professional career in the financial market as a trader interested in stocks and obligations.


