|

Technical analysis: Will the rice price reverse its falling?

Recommendation for rough rice: Sell

Sell Stop: Below 13.16.

Stop Loss: Above 13.56.

IndicatorSignal
RSINeutral
MACDSell
Donchian ChannelNeutral
MA(200) 
FractalsSell
Parabolic SARSell

Chart analysis

AUDNZD

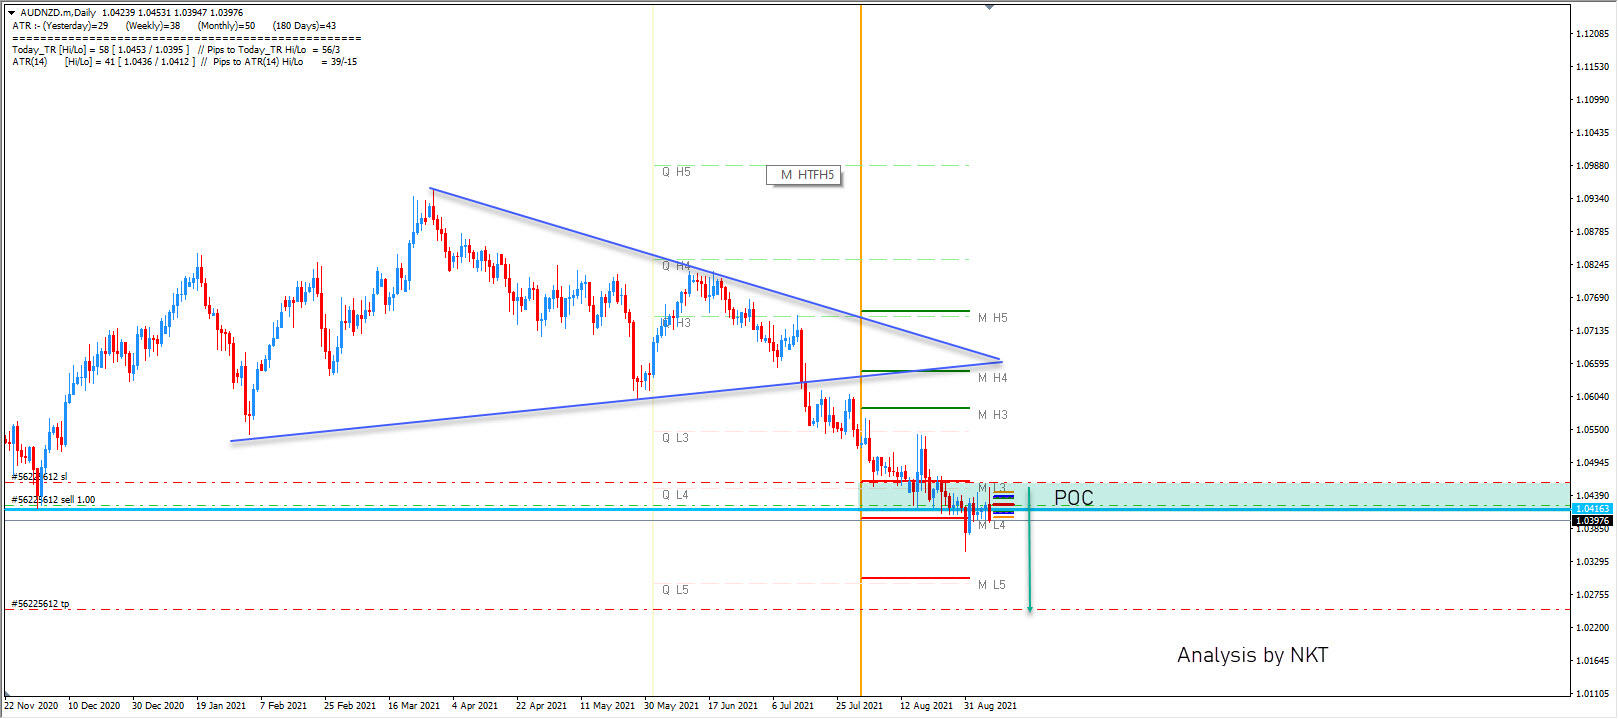
The #C-RICE technical analysis of the price chart in daily timeframe shows #C-RICE, D1 has fallen to test unsuccessfully the 200-day moving average MA(200), which is rising still. We believe the bearish momentum will continue as the price breaches below the lower bound of Donchian channel at 13.16. A pending order to sell can be placed below that level. The stop loss can be placed above 13.56. After placing the order, the stop loss is to be moved every day to the next fractal high, following Parabolic signals. Thus, we are changing the expected profit/loss ratio to the breakeven point. If the price meets the stop loss level without reaching the order, we recommend cancelling the order: the market has undergone internal changes which were not taken into account.

Fundamental analysis

USDA’s weekly net export sales report indicated rice export sales were on the rise. Will the rice price reverse its falling?

US Department of Agriculture weekly net export sales report a couple weeks ago indicated net sales volume was up 84% from previous week at 79,500 metric tons. Higher export sales which point to strong demand are bullish for rice price. At the same time this year the US harvest is expected to be at least 15% off from last year, which is an additional upside risk for rice price. However the current technical setup is bearish for #C-RICE.


Want to get more free analytics? Open Demo Account now to get daily news and analytical materials.


Want to get more free analytics? Open Demo Account now to get daily news and analytical materials.

Author

Dmitry  Lukashov

Dmitry Lukashov

IFC Markets

Dimtry Lukashov is the senior analyst of IFC Markets. He started his professional career in the financial market as a trader interested in stocks and obligations.

More from Dmitry Lukashov
Share:

Markets move fast. We move first.

Orange Juice Newsletter brings you expert driven insights - not headlines. Every day on your inbox.

By subscribing you agree to our Terms and conditions.

Editor's Picks

EUR/USD drops to daily lows near 1.1630

EUR/USD now loses some traction and slips back to the area of daily lows around 1.1630 on the back of a mild bounce in the US Dollar. Fresh US data, including the September PCE inflation numbers and the latest read on December consumer sentiment, didn’t really move the needle, so the pair is still on course to finish the week with a respectable gain.

GBP/USD trims gains, recedes toward 1.3320

GBP/USD is struggling to keep its daily advance, coming under fresh pressure and retreating to the 1.3320 zone following a mild bullish attempt in the Greenback. Even though US consumer sentiment surprised to the upside, the US Dollar isn’t getting much love, as traders are far more interested in what the Fed will say next week.

Gold makes a U-turn, back to $4,200

Gold is now losing the grip and receding to the key $4,200 region per troy ounce following some signs of life in the Greenback and a marked bounce in US Treasury yields across the board. The positive outlook for the precious metal, however, remains underpinned by steady bets for extra easing by the Fed.

Crypto Today: Bitcoin, Ethereum, XRP pare gains despite increasing hopes of upcoming Fed rate cut

Bitcoin is steadying above $91,000 at the time of writing on Friday. Ethereum remains above $3,100, reflecting positive sentiment ahead of the Federal Reserve's (Fed) monetary policy meeting on December 10.

Week ahead – Rate cut or market shock? The Fed decides

Fed rate cut widely expected; dot plot and overall meeting rhetoric also matter. Risk appetite is supported by Fed rate cut expectations; cryptos show signs of life. RBA, BoC and SNB also meet; chances of surprises are relatively low.

Ripple faces persistent bear risks, shrugging off ETF inflows

Ripple is extending its decline for the second consecutive day, trading at $2.06 at the time of writing on Friday. Sentiment surrounding the cross-border remittance token continues to lag despite steady inflows into XRP spot ETFs.