Technical analysis: Will the rice price continue its climbing?

Recommendation for rough rice: Buy
Buy Stop: Above 13.17.
Stop Loss: Below 12.82.
RSI: Neutral.
MACD: Buy.
Donchian Channel: Buy.
MA(200): Sell.
Fractals: Buy.
Parabolic SAR: Buy.
Chart analysis
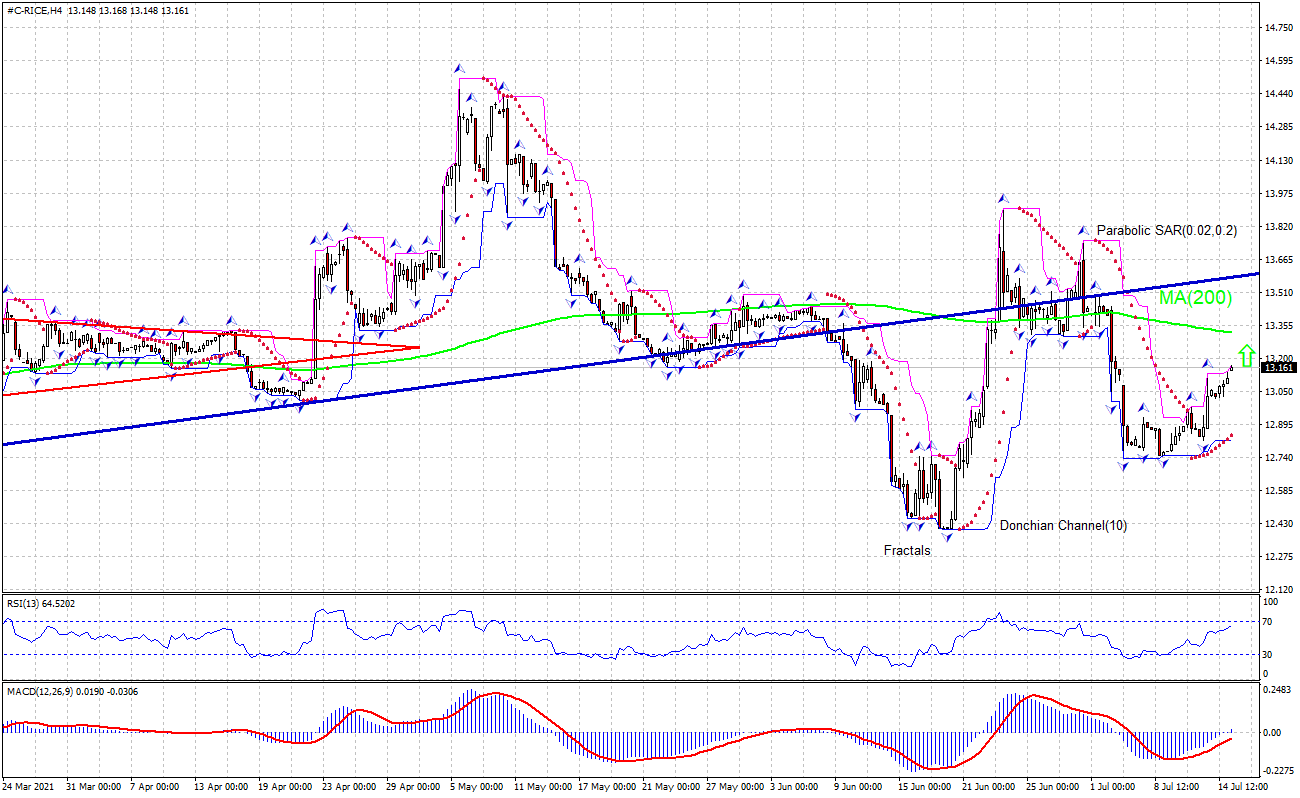
The #C-RICE technical analysis of the price chart on 4-hour timeframe shows #C-RICE, H4 is rebounding toward the 200-period moving average MA(200) which is falling still. We believe the bullish momentum will continue as the #C-RICE, H4 breaches above the upper Donchian boundary at 13.17. A pending order to buy can be placed above that level. The stop loss can be placed below 12.82. After placing the order, the stop loss is to be moved every day to the next fractal low, following Parabolic indicator signals. Thus, we are changing the expected profit/loss ratio to the breakeven point. If the price meets the stop loss level without reaching the order, we recommend canceling the order: the market has undergone internal changes which were not taken into account.
Fundamental analysis
USDA downgraded its estimate for 2021/22 rice global supply. Will the rice price continue its climbing? United States Department of Agriculture (USDA) Economic Research Service revised downward rice production in 2021/22 for the global and domestic rice market. It estimated global production at a record 506.0 million tons, down 0.6 million from the previous forecast. USDA lowered its 2021/22 crop forecasts for Egypt and the United States. In 2021/22, global ending stocks are forecast at 167.0 million tons, down 1.5 million from the previous forecast. 2021/22 U.S. rice crop is projected at 199.34 million cwt, down 2% from the previous forecast and more than 12% smaller than a year earlier. This month’s downward production revision is the result of a smaller harvested area estimate. At 2.616 million acres, the harvested area is 45,000 acres below the previous forecast and more than 12% below a year earlier. Global supply downgrade is bullish for rice price.
Want to get more free analytics? Open Demo Account now to get daily news and analytical materials.
Want to get more free analytics? Open Demo Account now to get daily news and analytical materials.
Author

Dmitry Lukashov
IFC Markets
Dimtry Lukashov is the senior analyst of IFC Markets. He started his professional career in the financial market as a trader interested in stocks and obligations.


