Technical analysis: Will the orange quotes grow?

Recommendation for Orange Juice: Buy
Buy Stop: Above 117,5
Stop Loss: Below 107,5
RSI: Neutral
MACD: Neutral
MA(200): Neutral
Fractals: Neutral
Parabolic SAR: Buy
Bollinger Bands: Neutral
Chart Analysis
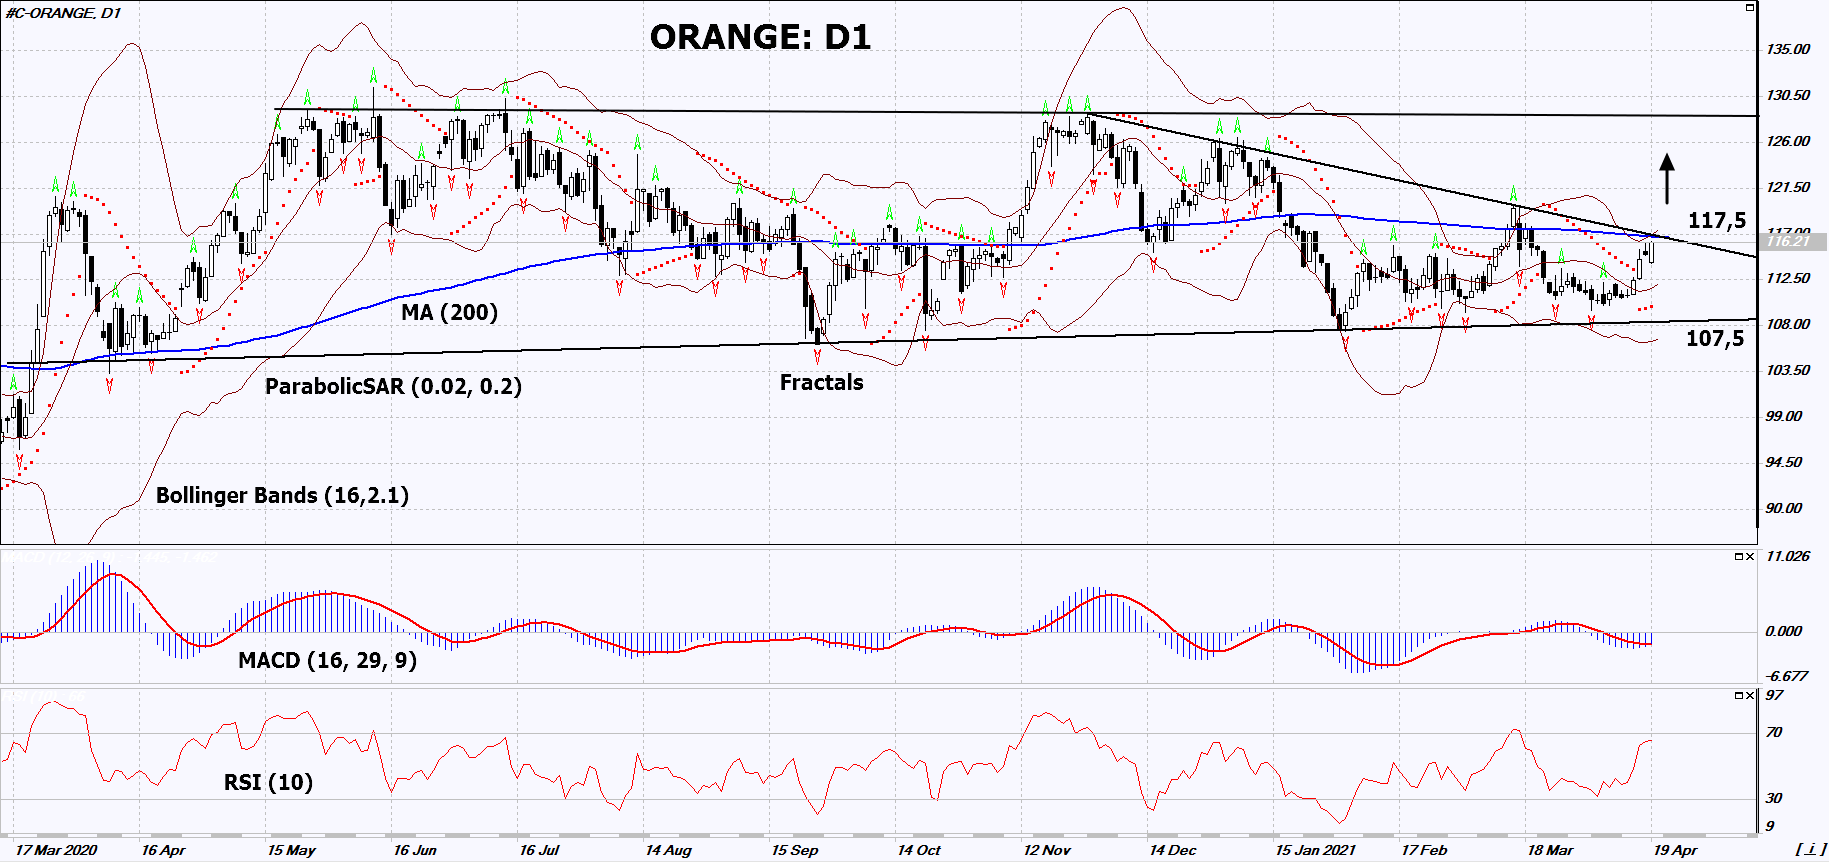
On the daily timeframe, ORANGE: D1 formed a Triangle and is moving towards the upper border of a wide neutral range. A number of technical analysis indicators formed signals for further growth. We do not rule out a bullish move if ORANGE rises above the Triangle resistance line, 200-day moving average and upper Bollinger band: 117.5. This level can be used as an entry point. We can place a stop loss below the Parabolic signal and the lower border of the neutral range: 107.5. After opening a pending order, we can move the stop loss to the next fractal low following the Bollinger and Parabolic signals. Thus, we change the potential profit/loss ratio in our favor. After the transaction, the most risk-averse traders can switch to the four-hour chart and place a stop loss, moving it in the direction of the bias. If the price meets the stop loss (107.5) without activating the order (117.5), it is recommended to delete the order: the market sustains internal changes that have not been taken into account.
Fundamental Analysis
The United States Department of Agriculture (USDA) lowered its forecast for the US orange crop. Will the ORANGE quotes grow? The USDA now expects the US orange harvest to amount to 4.45 million tons in the 2020/2021 agricultural season. This is 4% less than the previous estimate and 15% less than in the 2019/2020 season. At the same time, the orange crop in Florida may decrease by 23%, in California - by 4%, and in Texas - by 22%. Recall that in the previous 2019/2020 season, the orange harvest decreased by almost 4% compared to the 2018/2019 season. Thus, the negative dynamics may last for 2 seasons in a row. US stocks of frozen orange juice concentrate in February this year were 16% lower than in February 2020.
Want to get more free analytics? Open Demo Account now to get daily news and analytical materials.
Want to get more free analytics? Open Demo Account now to get daily news and analytical materials.
Author

Dmitry Lukashov
IFC Markets
Dimtry Lukashov is the senior analyst of IFC Markets. He started his professional career in the financial market as a trader interested in stocks and obligations.