Technical analysis: Will NATGAS quotes continue to decline?
Recommendation for natural gas: Sell
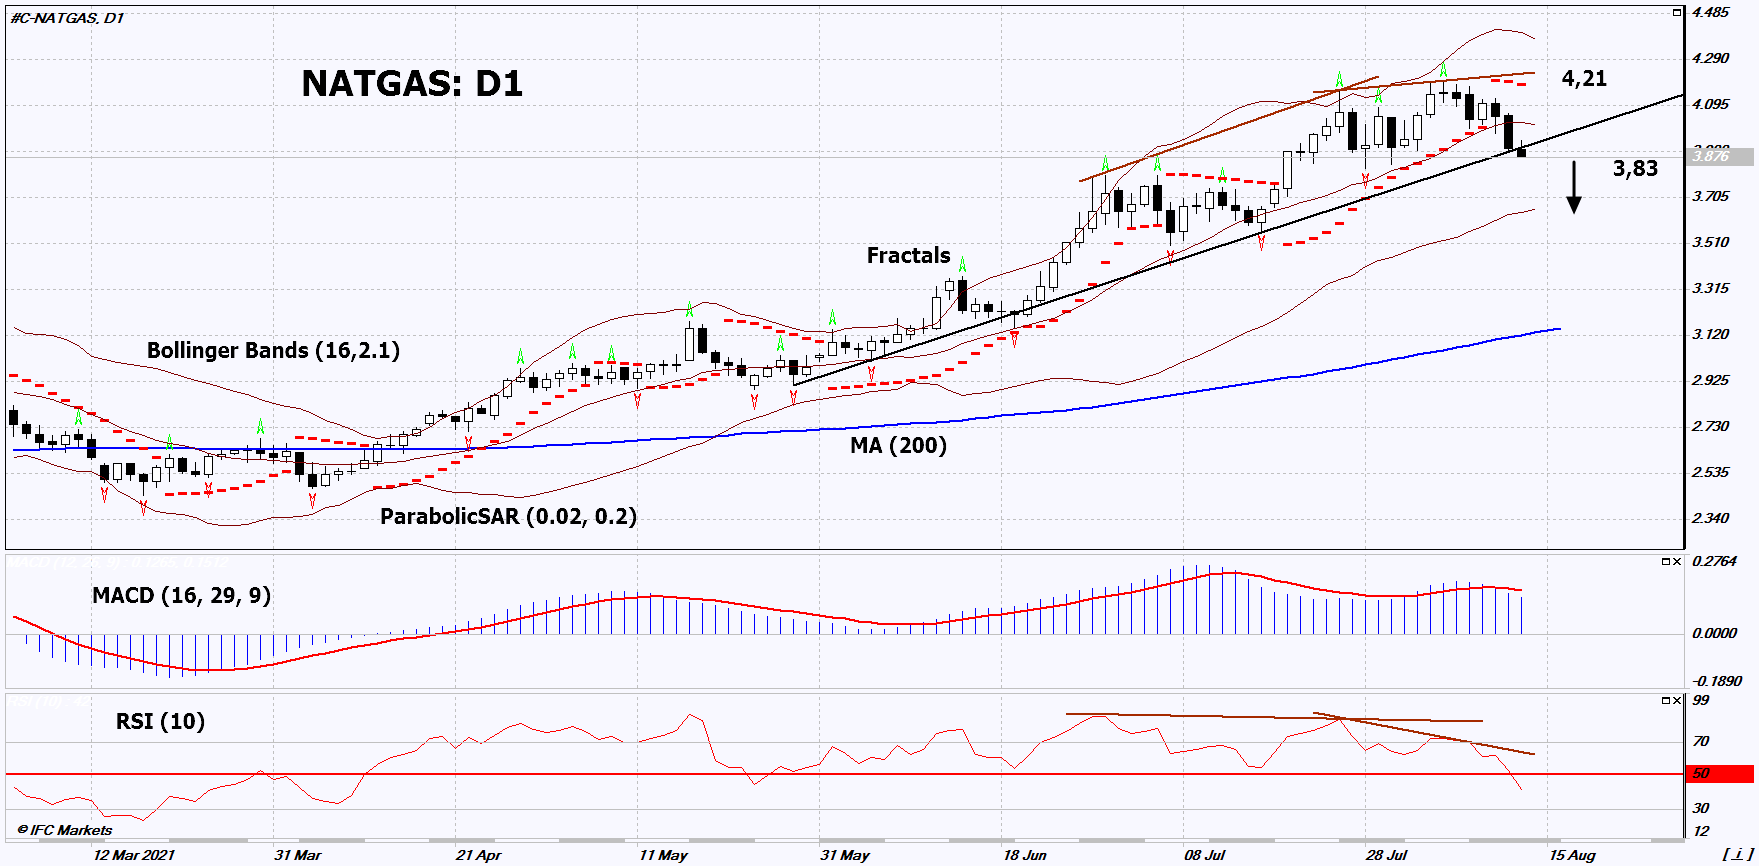
On the daily timeframe, NATGAS: D1 broke down the uptrend support line. A number of technical analysis indicators have formed signals for a decline. We do not exclude a bearish movement if NATGAS falls below the last lower fractal: 3.83. This level can be used as an entry point. The initial risk limitation is possible above the last fractal high, the maximum since December 2018 and the Parabolic signal: 4.21. After opening a pending order, move the stop to the next fractal low following the Bollinger and Parabolic signals. Thus, we change the potential profit/loss ratio in our favor. The most cautious traders, after making a deal, can go to the four-hour chart and set a stop-loss, moving it in the direction of movement. If the price overcomes the stop level (4.21) without activating the order (3.83), it is recommended to delete the order: there are internal changes in the market that were not taken into account.
Fundamental analysis
In the United States, natural gas reserves have increased and air temperatures have dropped. Will NATGAS quotes continue to decline?
Commodity Weather Group predicts a decrease in US air temperatures, which could reduce demand for electricity for air conditioning. Natural gas is used to generate electricity. According to preliminary estimates for August, the Michigan Consumer Sentiment indicator fell to its lowest level since December 2011 at 70.2 points. This may indicate an additional decrease in the demand for electricity for air conditioners from the US population. According to the U.S. Energy Information Administration (EIA), US natural gas reserves increased by 49 billion cubic feet over the week. This is more than expected (47 Bcf) and above the 5-year average (42 Bcf). According to BloombergNEF, consumption of natural gas in the United States last week decreased by 3.9% compared to the same week last year, while gas production increased by 2.5%.
Want to get more free analytics? Open Demo Account now to get daily news and analytical materials.
Want to get more free analytics? Open Demo Account now to get daily news and analytical materials.
Author

Dmitry Lukashov
IFC Markets
Dimtry Lukashov is the senior analyst of IFC Markets. He started his professional career in the financial market as a trader interested in stocks and obligations.


