Cold snap in the US may increase gas demand for heating

A cold snap is expected in the US in late January. Will the NATGAS rise?
Demand for gas may increase as it is used for heating. Since the beginning of the US heating season in November 2019, gas prices have fallen by 27%. Its production is now by 6.6 billion cubic feet per day higher than the last year's level and amounts to 94.9 billion cubic feet per day. Due to this, the United States reduced gas imports from Canada. According to various estimates, 23 billion cubic feet per day more of gas than is being consumed currently this week may be required in case of a cold snap. Let us note that gas production and its consumption in the US are now close to historical highs. The U.S. Energy Information Administration (EIA) forecasts an increase in net exports of liquefied natural gas from the United States by 2 billion cubic feet per day in 2020 compared to last year and by another 1.6 billion cubic feet per day in 2021. This may become the main long-term factor for an increase in US natural gas prices,
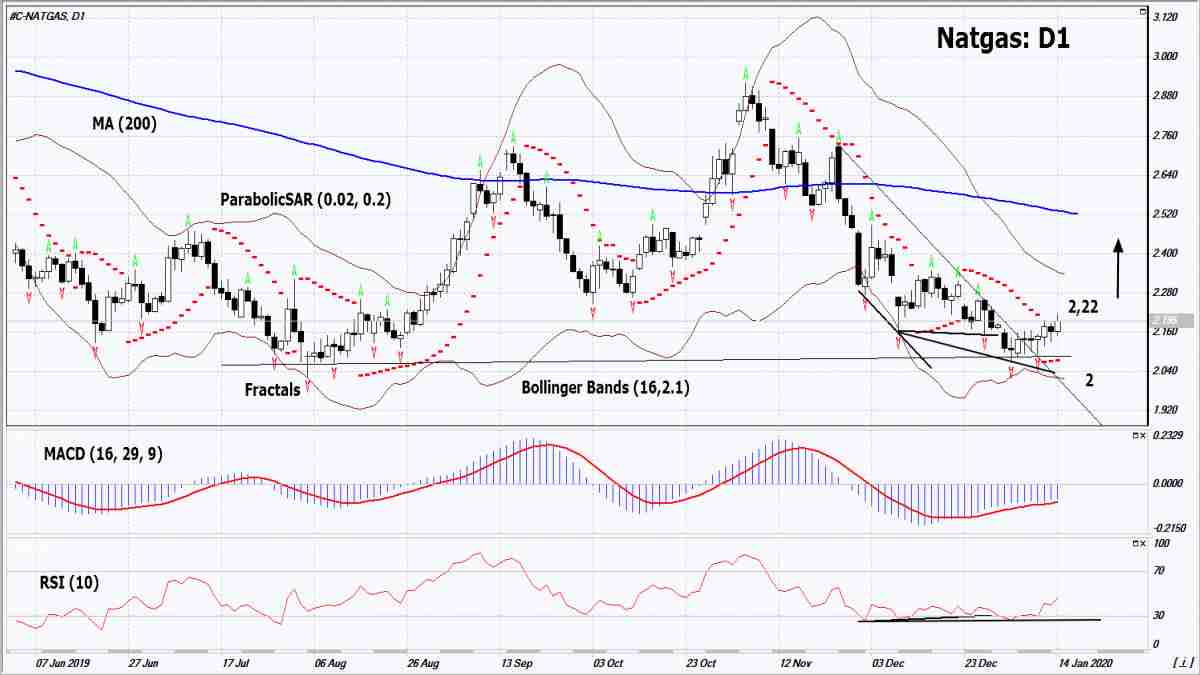
On the daily timeframe, the Natgas: D1 breached up the resistance line of the downtrend and is correcting upward. It bounced off the support line of a wide neutral range. A number of technical analysis indicators formed buy signals. The further price increase is possible in case of increased demand in the US.
-
The Parabolic indicator gives a bullish signal.
-
The Bollinger bands have narrowed, which indicates low volatility.
-
The RSI indicator is below 50. It has formed some positive divergences.
-
The MACD indicator gives a bullish signal.
The bullish momentum may develop in case Natgas exceeds its last high at 2.22. This level may serve as an entry point. The initial stop loss may be placed below the two last fractal lows, the lower Bollinger band, the low since April 2016 and the Parabolic signal at 2. After opening the pending order, we shall move the stop to the next fractal low following the Bollinger and Parabolic signals. Thus, we are changing the potential profit/loss to the breakeven point. More risk-averse traders may switch to the 4-hour chart after the trade and place there a stop loss moving it in the direction of the trade. If the price meets the stop level (2) without reaching the order (2,22), we recommend to close the position: the market sustains internal changes that were not taken into account.
Summary of technical analysis
| Position | Buy |
| Buy stop | Above 2.22 |
| Stop loss | Below 2 |
Want to get more free analytics? Open Demo Account now to get daily news and analytical materials.
Want to get more free analytics? Open Demo Account now to get daily news and analytical materials.
Author

Dmitry Lukashov
IFC Markets
Dimtry Lukashov is the senior analyst of IFC Markets. He started his professional career in the financial market as a trader interested in stocks and obligations.


