Technical analysis: Will the cotton price rebound persist?
Recommendation for Cotton: Buy
Buy Stop։ Above 94.5
Stop Loss։ Below 91.6
| Indicator | Signal |
| RSI | Sell |
| MACD | Buy |
| Donchian Channel | Neutral |
| MA(200) | Buy |
| Fractals | Buy |
| Parabolic SAR | Buy |
| Fibonacci | Buy |
Chart analysis
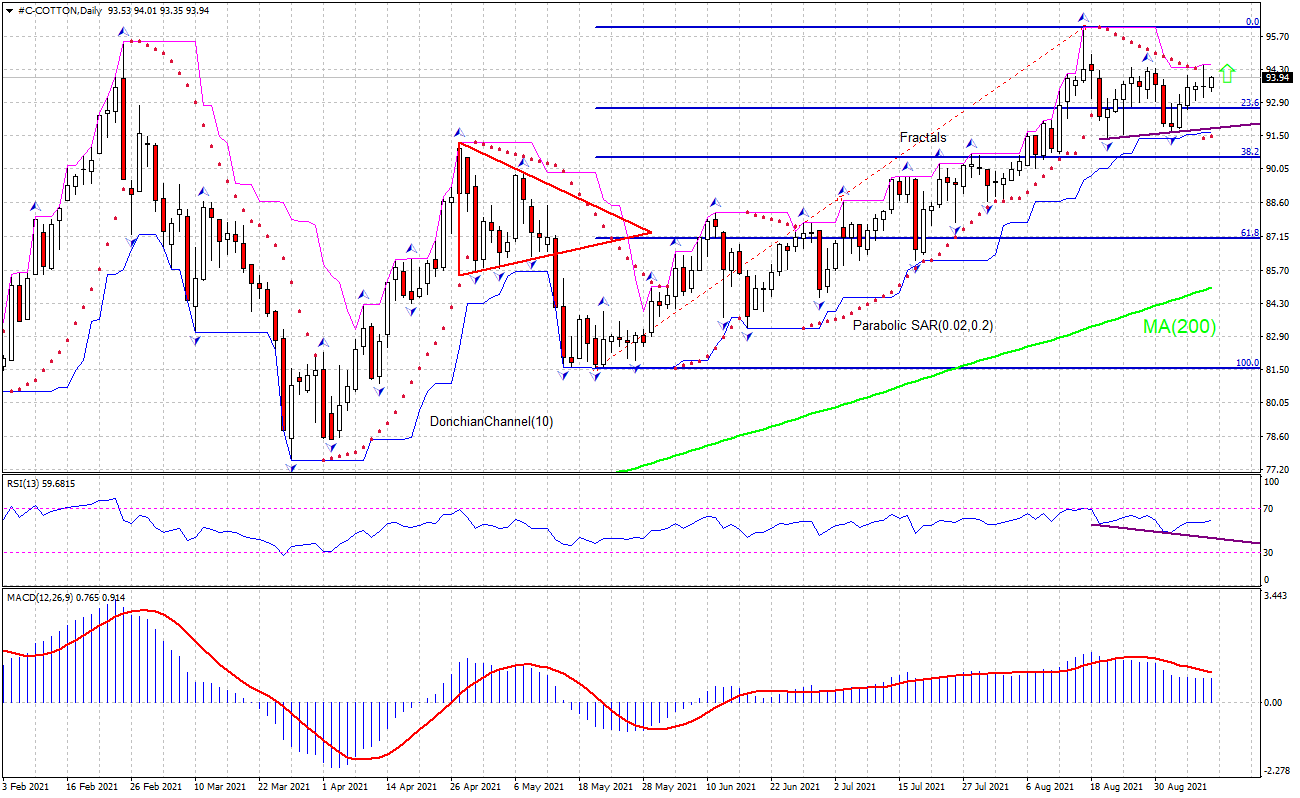
The #C-COTTON technical analysis of the price chart in the daily timeframe shows #C-COTTON, Daily is rebounding following retracement from seven- and-half year high it hit three weeks ago. The RSI indicator has formed a bearish divergence though. We believe the bullish momentum will continue after the price breaches above the upper Donchian boundary at 94.5. This level can be used as an entry point for placing a pending order to buy. The stop loss can be placed below 91.6. After placing the pending order the stop loss is to be moved every day to the next fractal low, following Parabolic signals. Thus, we are changing the expected profit/loss ratio to the breakeven point. If the price meets the stop-loss level (91.6) without reaching the order (94.55) we recommend cancelling the order: the market sustains internal changes which were not taken into account.
Fundamental analysis
USDA crop report downgraded domestic cotton crop quality estimates on Tuesday. Will the cotton price rebound persist?
Two days ago US Department of Agriculture released its latest Crop Progress Report indicating quality of the cotton crop nationwide deteriorated. USDA's weekly report showed that 61% of the cotton crop in 15 States that planted 99% of the 2020 cotton acreage nationally is rated good to excellent, down from 70% the previous week. Estimates of lower proportion of higher quality cotton crop translate into expectations of lower supply of the commodity, which is bullish for the #C-COTTON.
Want to get more free analytics? Open Demo Account now to get daily news and analytical materials.
Want to get more free analytics? Open Demo Account now to get daily news and analytical materials.
Author

Dmitry Lukashov
IFC Markets
Dimtry Lukashov is the senior analyst of IFC Markets. He started his professional career in the financial market as a trader interested in stocks and obligations.


