#C-Cotton technical analysis: Will Cotton quotes rise?

Chart Analysis
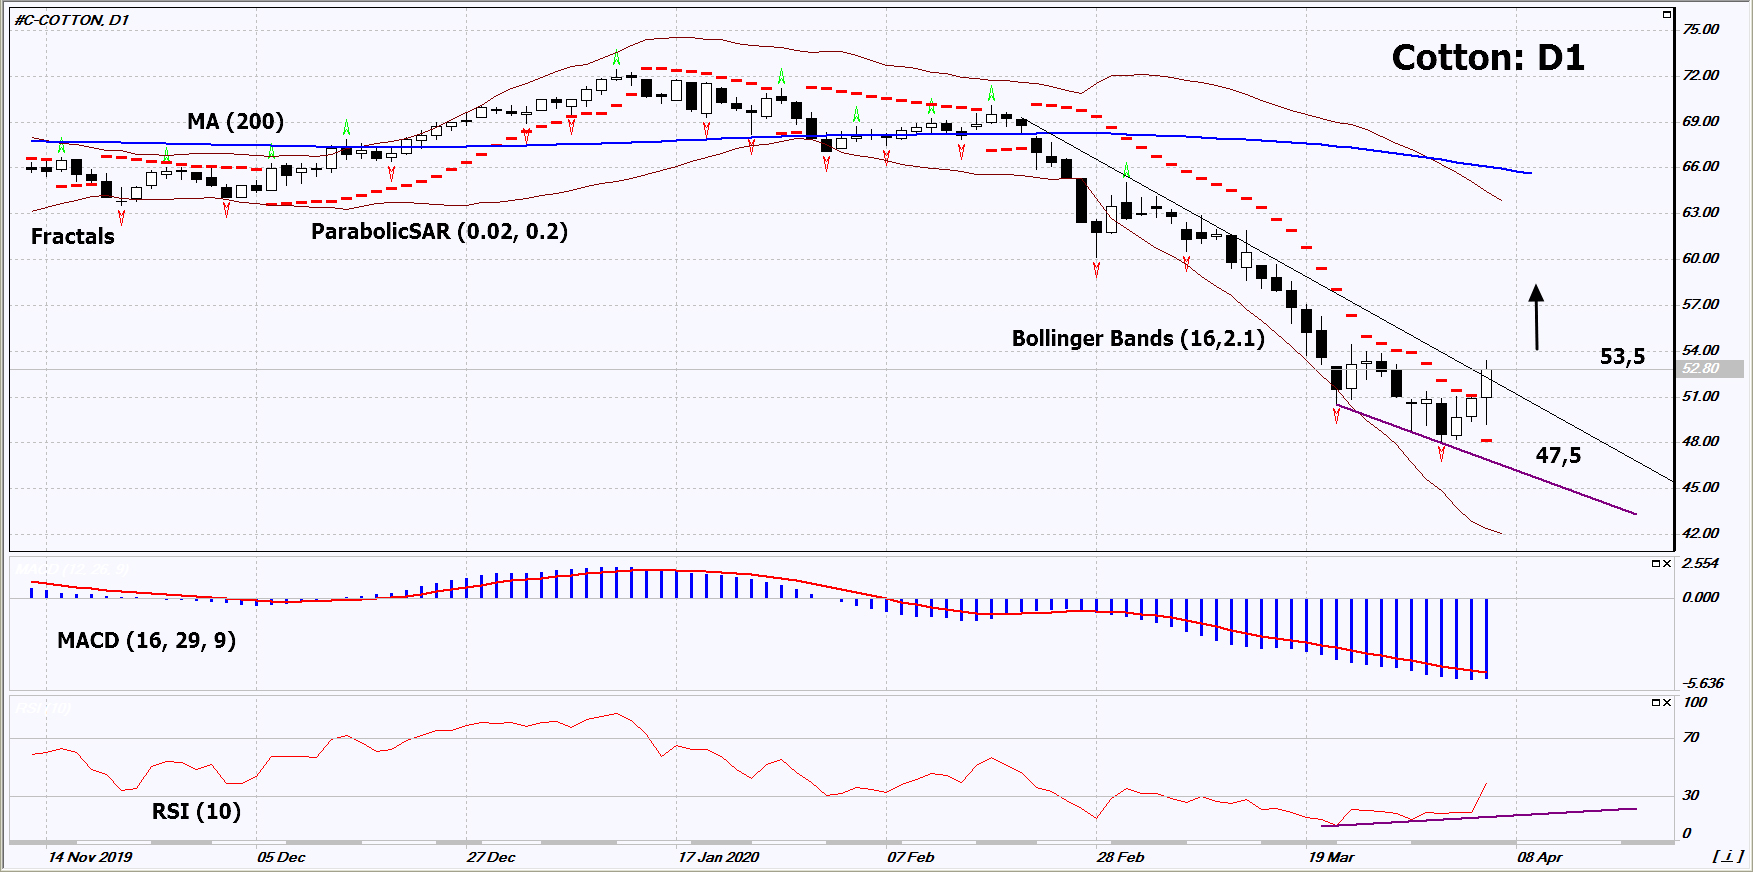
On the daily timeframe, Cotton: D1 broke above the support line for the short-term downtrend. Now it is correcting upwards from the minimum since 2009. A number of indicators of technical analysis formed signals for the further increase. We do not exclude a bullish movement if Cotton rises above its last maximum: 53.5. This level can be used as an entry point. Stop loss is possible below the Parabolic signal, the last lower fractal and the 11-year low: 47.5. After opening the pending order, the we move the stop loss after the signals of Bollinger and Parabolic to the next fractal minimum. Thus, we change the potential profit / loss ratio in our favor. After the transaction, the most risk-averse traders can switch to a four-hour chart and set a stop loss, moving it in the direction of movement. If the price overcomes the stop level (47.5) without activating the order (53.5), it is recommended to delete the order: some internal changes in the market have not been taken into account.
| Indicator | Value | Signal |
| RSI | Buy | |
| MACD | Neutral | |
| MA(200) | Neutral | |
| Fractals | Neutral | |
| Parabolic SAR | Buy | |
| Bollinger Bands | Neutral |
Fundamental Analysis
The USDA predicts a decrease in cotton yields in India. Will Cotton quotes rise?
Want to get more free analytics? Open Demo Account now to get daily news and analytical materials.
Want to get more free analytics? Open Demo Account now to get daily news and analytical materials.
Author

Dmitry Lukashov
IFC Markets
Dimtry Lukashov is the senior analyst of IFC Markets. He started his professional career in the financial market as a trader interested in stocks and obligations.


