Lower cotton supply forecast bullish for Cotton price

Analysts expect lower US cotton production. Will the Cotton price rise continue?
"Shortly thereafter" of January 15 the US and China will sign the Phase One treaty, which is expected to help increase exports of US agricultural products that suffered during the tariff war. Cotton has been one of agricultural products that suffered during the US – China trade war. Couple of days ago the Commerce Department reported the US trade deficit narrowed 8.2% in December, following 15% decline in November in America’s annual trade deficit with China. At the same time analysts forecast a 500,000-bale cut to 2019 US cotton production. Lower US production and ending stocks are bullish for cotton price. Today the US Department of Agriculture issues its January World Agricultural Supply and Demand Estimates report. More optimistic WASDE output forecast is a downside risk for cotton prices.
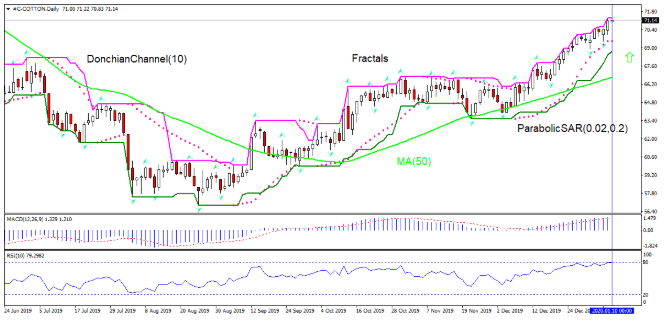
On the Daily timeframe Cotton: D1 is rising. Price is trading above the 50 moving averages MA(50), which is rising too.
-
The Parabolic Indicator gives a buy signal.
-
The Donchian channel indicates uptrend: it is narrowing up.
-
The RSI indicator is about to breach into the overbought zone.
-
The MACD indicator gives a bullish signal: it is above the signal line and the gap is widening.
We believe the bullish momentum will continue after the price breaches above the upper boundary of Donchian channel at 71.3. A level above this can be used as an entry point for placing a pending order to buy. The stop loss can be placed below the lower Donchian boundary at 68.75. After placing the order, the stop loss is to be moved every day to the next fractal low, following Parabolic signals. Thus, we are changing the expected profit/loss ratio to the breakeven point. If the price meets the stop loss level (68.75) without reaching the order (above 71.3), we recommend cancelling the order: the market has undergone internal changes which were not taken into account.
Technical Analysis Summary
| Order | Buy |
| Buy stop | Above 71.3 |
| Stop loss | Below 68.75 |
Want to get more free analytics? Open Demo Account now to get daily news and analytical materials.
Want to get more free analytics? Open Demo Account now to get daily news and analytical materials.
Author

Dmitry Lukashov
IFC Markets
Dimtry Lukashov is the senior analyst of IFC Markets. He started his professional career in the financial market as a trader interested in stocks and obligations.
















